I recently visited a data science meetup where one of the speakers — Harm Bodewes — spoke about playing out the Monty Hall problem with his kids.
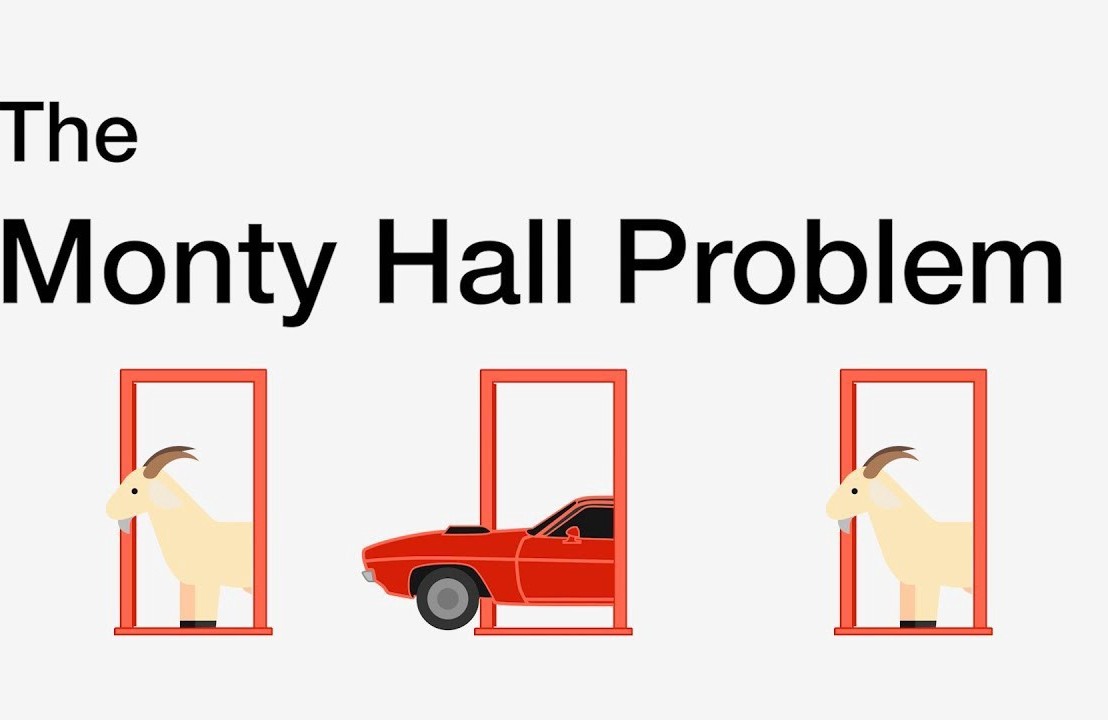
TheMonty Hall problemis probability puzzle. Based on the American television game show Let’s Make a Deal and its host, named Monty Hall:
You’re given the choice of three doors.
Behind one door sits a prize: a shiny sports car.
Behind the others doors, something shitty, like goats.
You pick a door — say, door 1.
Now, the host, who knows what’s behind the doors, opens one of the other doors — say, door 2 — which reveals a goat.
The host then asks you: Do you want to stay with door 1, or would you like to switch to door 3?
The probability puzzle here is:
Is switching doors the smart thing to do?
Back to my meetup.
Harm — the presenter — had ran the Monty Hall experiment with his kids.
Twenty-five times, he had hidden candy under one of three plastic cups. His kids could then pick a cup, he’d remove one of the non-candy cups they had not picked, and then he’d proposed them to make the switch.
The results he had tracked, and visualized in a simple Excel graph. And here he was presenting these results to us, his Meetup audience.
People (also statisticans) had been arguing whether it is best to stay or switch doors for years. Yet, here, this random guy ran a play-experiment and provided very visual proof removing any doubts you might have yourself.
You really need to switch doors!
At about the same time, I came across this Github repo by Saghir, who had made some vectorised simulations of the problem in R. I thought it was a fun excercise to simulate and visualize matters in two different data science programming languages — Python & R — and see what I’d run in to.
So I’ll cut to the chase.
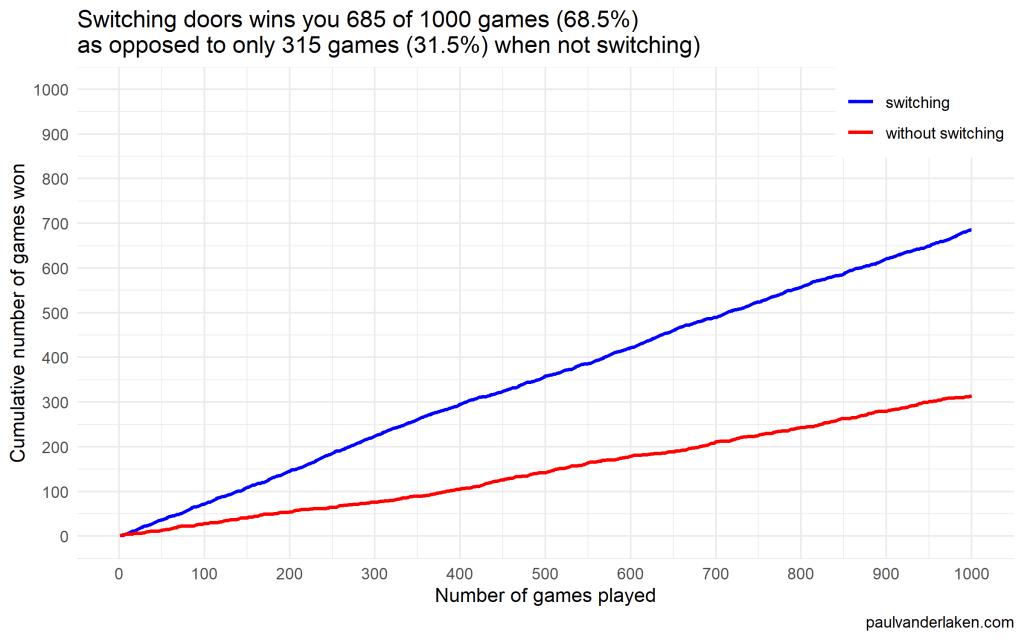
As we play more and more games against Monty Hall, it becomes very clear that you really, really, really need to switch doors in order to maximize the probability of winning a car.
Actually, the more games we play, the closer the probability of winning in our sample gets to the actual probability.
Even after 1000 games, the probabilities are still not at their actual values. But, ultimately…
If you stick to your door, you end up with the car in only 33% of the cases.
If you switch to the other door, you end up with the car 66% of the time!
Simulation Code
In both Python and R, I wrote two scripts. You can find the most recent version of the code on my Github. However, I pasted the versions of March 4th 2020 below.
The first script contains a function simulating a single game of Monty Hall. A second script runs this function an X amount of times, and visualizes the outcomes as we play more and more games.
Python
simulate_game.py
import random

def simulate_game(make_switch=False, n_doors=3, seed=None):
    '''
    Simulate a game of Monty Hall
    For detailed information: https://en.wikipedia.org/wiki/Monty_Hall_problem
    Basically, there are several closed doors and behind only one of them is a prize.
    The player can choose one door at the start.
    Next, the game master (Monty Hall) opens all the other doors, but one.
    Now, the player can stick to his/her initial choice or switch to the remaining closed door.
    If the prize is behind the player's final choice he/she wins.

    Keyword arguments:
    make_switch -- a boolean value whether the player switches after its initial choice and Monty Hall opening all other non-prize doors but one (default False)
    n_doors -- an integer value > 2, for the number of doors behind which one prize and (n-1) non-prizes (e.g., goats) are hidden (default 3)
    seed -- a seed to set (default None)
    '''

    # check the arguments
    if type(make_switch) is not bool:
        raise TypeError("`make_switch` must be boolean")
    if type(n_doors) is float:
        n_doors = int(n_doors)
        raise Warning("float value provided for `n_doors`: forced to integer value of", n_doors)
    if type(n_doors) is not int:
        raise TypeError("`n_doors` needs to be a positive integer > 2")
    if n_doors < 2:
        raise ValueError("`n_doors` needs to be a positive integer > 2")

    # if a seed was provided, set it
    if seed is not None:
        random.seed(seed)

    # sample one index for the door to hide the car behind
    prize_index = random.randint(0, n_doors - 1)

    # sample one index for the door initially chosen by the player
    choice_index = random.randint(0, n_doors - 1)

    # we can test for the current result
    current_result = prize_index == choice_index

    # now Monty Hall opens all doors the player did not choose, except for one door
    # next, he asks the player if he/she wants to make a switch
    if (make_switch):
        # if we do, we change to the one remaining door, which inverts our current choice
        # if we had already picked the prize door, the one remaining closed door has a nonprize
        # if we had not already picked the prize door, the one remaining closed door has the prize
        return not current_result
    else:
        # the player sticks with his/her original door,
        # which may or may not be the prize door
        return current_result
visualize_game_results.py
from simulate_game import simulate_game
from random import seed
from numpy import mean, cumsum
from matplotlib import pyplot as plt
import os
# set the seed here
# do not set the `seed` parameter in `simulate_game()`,
# as this will make the function retun `n_games` times the same results
seed(1)
# pick number of games you want to simulate
n_games = 1000
# simulate the games and store the boolean results
results_with_switching = [simulate_game(make_switch=True) for _ in range(n_games)]
results_without_switching = [simulate_game(make_switch=False) for _ in range(n_games)]
# make a equal-length list showing, for each element in the results, the game to which it belongs
games = [i + 1 for i in range(n_games)]
# generate a title based on the results of the simulations
title = f'Switching doors wins you {sum(results_with_switching)} of {n_games} games ({mean(results_with_switching) * 100:.1f}%)' + \
'\n' + \
f'as opposed to only {sum(results_without_switching)} games ({mean(results_without_switching) * 100:.1f}%) when not switching'
# set some basic plotting parameters
w = 8
h = 5
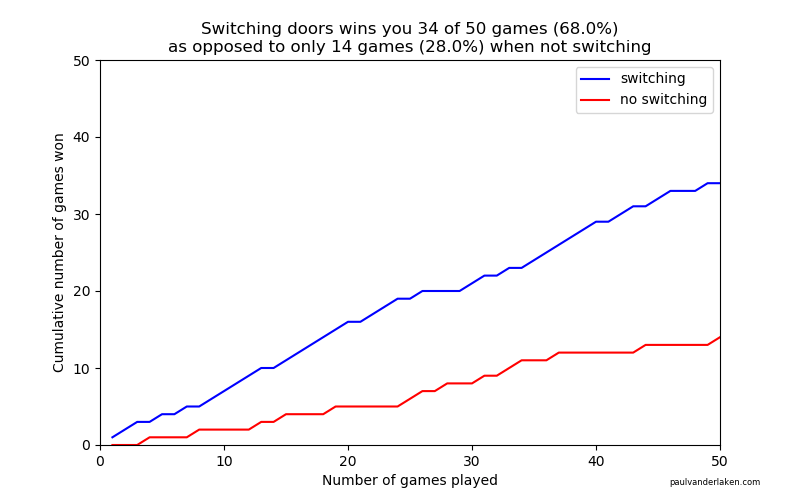
# make a line plot of the cumulative wins with and without switching
plt.figure(figsize=(w, h))
plt.plot(games, cumsum(results_with_switching), color='blue', label='switching')
plt.plot(games, cumsum(results_without_switching), color='red', label='no switching')
plt.axis([0, n_games, 0, n_games])
plt.title(title)
plt.legend()
plt.xlabel('Number of games played')
plt.ylabel('Cumulative number of games won')
plt.figtext(0.95, 0.03, 'paulvanderlaken.com', wrap=True, horizontalalignment='right', fontsize=6)
# you can uncomment this to see the results directly,
# but then python will not save the result to your directory
# plt.show()
# plt.close()
# create a directory to store the plots in
# if this directory does not yet exist
try:
os.makedirs('output')
except OSError:
None
plt.savefig('output/monty-hall_' + str(n_games) + '_python.png')
Visualizations (matplotlib)
R
simulate-game.R
Note that I wrote a second function, simulate_n_games, which just runs simulate_game an N number of times.
#' Simulate a game of Monty Hall
#' For detailed information: https://en.wikipedia.org/wiki/Monty_Hall_problem
#' Basically, there are several closed doors and behind only one of them is a prize.
#' The player can choose one door at the start.
#' Next, the game master (Monty Hall) opens all the other doors, but one.
#' Now, the player can stick to his/her initial choice or switch to the remaining closed door.
#' If the prize is behind the player's final choice he/she wins.
#'
#' @param make_switch A boolean value whether the player switches after its initial choice and Monty Hall opening all other non-prize doors but one. Defaults to `FALSE`
#' @param n_doors An integer value > 2, for the number of doors behind which one prize and (n-1) non-prizes (e.g., goats) are hidden. Defaults to `3L`
#' @param seed A seed to set. Defaults to `NULL`
#'
#' @return A boolean value indicating whether the player won the prize
#'
#' @examples
#' simulate_game()
#' simulate_game(make_switch = TRUE)
#' simulate_game(make_switch = TRUE, n_doors = 5L, seed = 1)
simulate_game = function(make_switch = FALSE, n_doors = 3L, seed = NULL) {

  # check the arguments
  if (!is.logical(make_switch) | is.na(make_switch)) stop("`make_switch` needs to be TRUE or FALSE")
  if (is.double(n_doors)) {
    n_doors = as.integer(n_doors)
    warning(paste("double value provided for `n_doors`: forced to integer value of", n_doors))
  }
  if (!is.integer(n_doors) | n_doors < 2) stop("`n_doors` needs to be a positive integer > 2")

  # if a seed was provided, set it
  if (!is.null(seed)) set.seed(seed)

  # create a integer vector for the door indices
  doors = seq_len(n_doors)

  # create a boolean vector showing which doors are opened
  # all doors are closed at the start of the game
  isClosed = rep(TRUE, length = n_doors)

  # sample one index for the door to hide the car behind
  prize_index = sample(doors, size = 1)

  # sample one index for the door initially chosen by the player
  # this can be the same door as the prize door
  choice_index = sample(doors, size = 1)

  # now Monty Hall opens all doors the player did not choose
  # except for one door
  # if we have already picked the prize door, the one remaining closed door has a nonprize
  # if we have not picked the prize door, the one remaining closed door has the prize
  if (prize_index == choice_index) {
    # if we have the prize, Monty Hall can open all but two doors:
    #   ours, which we remove from the options to sample from and open
    #   and one goat-conceiling door, which we do not open
    isClosed[sample(doors[-prize_index], size = n_doors - 2)] = FALSE
  } else {
    # else, Monty Hall can also open all but two doors:
    #   ours
    #   and the prize-conceiling door
    isClosed[-c(prize_index, choice_index)] = FALSE
  }

  # now Monty Hall asks us whether we want to make a switch
  if (make_switch) {
    # if we decide to make a switch, we can pick the closed door that is not our door
    choice_index = doors[isClosed][doors[isClosed] != choice_index]
  }

  # we return a boolean value showing whether the player choice is the prize door
  return(choice_index == prize_index)
}


#' Simulate N games of Monty Hall
#' Calls the `simulate_game()` function `n` times and returns a boolean vector representing the games won
#'
#' @param n An integer value for the number of times to call the `simulate_game()` function
#' @param seed A seed to set in the outer loop. Defaults to `NULL`
#' @param ... Any parameters to be passed to the `simulate_game()` function.
#' No seed can be passed to the simulate_game function as that would result in `n` times the same result
#'
#' @return A boolean vector indicating for each of the games whether the player won the prize
#'
#' @examples
#' simulate_n_games(n = 100)
#' simulate_n_games(n = 500, make_switch = TRUE)
#' simulate_n_games(n = 1000, seed = 123, make_switch = TRUE, n_doors = 5L)
simulate_n_games = function(n, seed = NULL, make_switch = FALSE, ...) {
  # round the number of iterations to an integer value
  if (is.double(n)) {
    n = as.integer(n)
  }
  if (!is.integer(n) | n < 1) stop("`n_games` needs to be a positive integer > 1")
  # if a seed was provided, set it
  if (!is.null(seed)) set.seed(seed)
  return(vapply(rep(make_switch, n), simulate_game, logical(1), ...))
}
visualize-game-results.R
Note that we source in the simulate-game.R file to get access to the simulate_game and simulate_n_games functions.
Also note that I make a second plot here, to show the probabilities of winning converging to their real-world probability as we play more and more games.
source('R/simulate-game.R')

# install.packages('ggplot2')
library(ggplot2)

# set the seed here
# do not set the `seed` parameter in `simulate_game()`,
# as this will make the function return `n_games` times the same results
seed = 1

# pick number of games you want to simulate
n_games = 1000

# simulate the games and store the boolean results
results_without_switching = simulate_n_games(n = n_games, seed = seed, make_switch = FALSE)
results_with_switching = simulate_n_games(n = n_games, seed = seed, make_switch = TRUE)

# store the cumulative wins in a dataframe
results = data.frame(
  game = seq_len(n_games),
  cumulative_wins_without_switching = cumsum(results_without_switching),
  cumulative_wins_with_switching = cumsum(results_with_switching)
)

# function that turns values into nice percentages
format_percentage = function(values, digits = 1) {
  return(paste0(formatC(values * 100, digits = digits, format = 'f'), '%'))
}

# generate a title based on the results of the simulations
title = paste(
  paste0('Switching doors wins you ', sum(results_with_switching), ' of ', n_games, ' games (', format_percentage(mean(results_with_switching)), ')'),
  paste0('as opposed to only ', sum(results_without_switching), ' games (', format_percentage(mean(results_without_switching)), ') when not switching)'),
  sep = '\n'
)

# set some basic plotting parameters
linesize = 1 # size of the plotted lines
x_breaks = y_breaks = seq(from = 0, to = n_games, length.out = 10 + 1) # breaks of the axes
y_limits = c(0, n_games) # limits of the y axis - makes y limits match x limits
w = 8 # width for saving plot
h = 5 # height for saving plot
palette = setNames(c('blue', 'red'), nm = c('switching', 'without switching')) # make a named color scheme

# make a line plot of the cumulative wins with and without switching
ggplot(data = results) +
  geom_line(aes(x = game, y = cumulative_wins_with_switching, col = names(palette[1])), size = linesize) +
  geom_line(aes(x = game, y = cumulative_wins_without_switching, col = names(palette[2])), size = linesize) +
  scale_x_continuous(breaks = x_breaks) +
  scale_y_continuous(breaks = y_breaks, limits = y_limits) +
  scale_color_manual(values = palette) +
  theme_minimal() +
  theme(legend.position = c(1, 1), legend.justification = c(1, 1), legend.background = element_rect(fill = 'white', color = 'transparent')) +
  labs(x = 'Number of games played') +
  labs(y = 'Cumulative number of games won') +
  labs(col = NULL) +
  labs(caption = 'paulvanderlaken.com') +
  labs(title = title)

# save the plot in the output folder
# create the output folder if it does not exist yet
if (!file.exists('output')) dir.create('output', showWarnings = FALSE)
ggsave(paste0('output/monty-hall_', n_games, '_r.png'), width = w, height = h)


# make a line plot of the rolling % win chance with and without switching
ggplot(data = results) +
  geom_line(aes(x = game, y = cumulative_wins_with_switching / game, col = names(palette[1])), size = linesize) +
  geom_line(aes(x = game, y = cumulative_wins_without_switching / game, col = names(palette[2])), size = linesize) +
  scale_x_continuous(breaks = x_breaks) +
  scale_y_continuous(labels = function(x) format_percentage(x, digits = 0)) +
  scale_color_manual(values = palette) +
  theme_minimal() +
  theme(legend.position = c(1, 1), legend.justification = c(1, 1), legend.background = element_rect(fill = 'white', color = 'transparent')) +
  labs(x = 'Number of games played') +
  labs(y = '% of games won') +
  labs(col = NULL) +
  labs(caption = 'paulvanderlaken.com') +
  labs(title = title)


# save the plot in the output folder
# create the output folder if it does not exist yet
if (!file.exists('output')) dir.create('output', showWarnings = FALSE)
ggsave(paste0('output/monty-hall_perc_', n_games, '_r.png'), width = w, height = h)
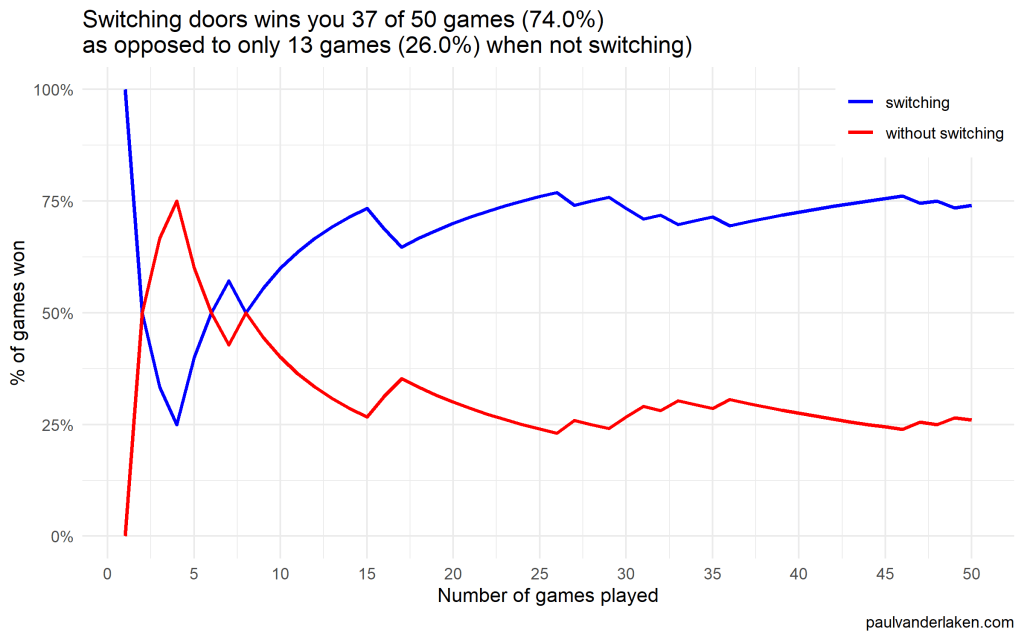
Visualizations (ggplot2)
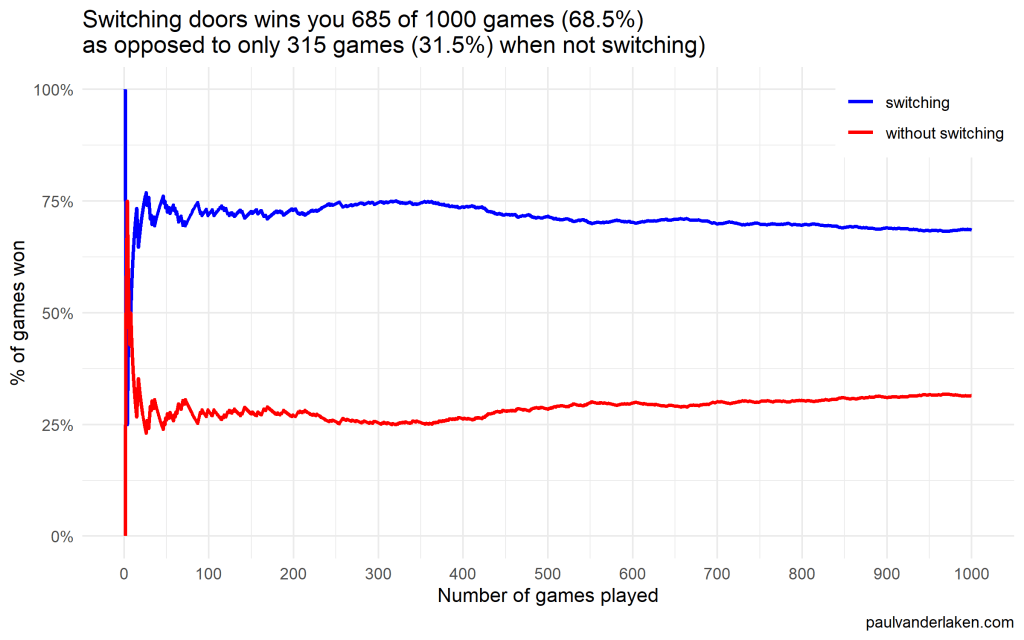
I specifically picked a seed (the second one I tried) in which not switching looked like it was better during the first few games played.
In R, I made an additional plot that shows the probabilities converging.
As we play more and more games, our results move to the actual probabilities of winning:
After the first four games, you could have erroneously concluded that not switching would result in better chances of you winning a sports car. However, in the long run, that is definitely not true.
I was actually suprised to see that these lines look to be mirroring each other. But actually, that’s quite logical maybe… We already had the car with our initial door guess in those games. If we would have sticked to that initial choice of a door, we would have won, whereas all the cases where we switched, we lost.
Keep me posted!
I hope you enjoyed these simulations and visualizations, and am curious to see what you come up with yourself!
For instance, you could increase the number of doors in the game, or the number of goat-doors Monty Hall opens. When does it become a disadvantage to switch?
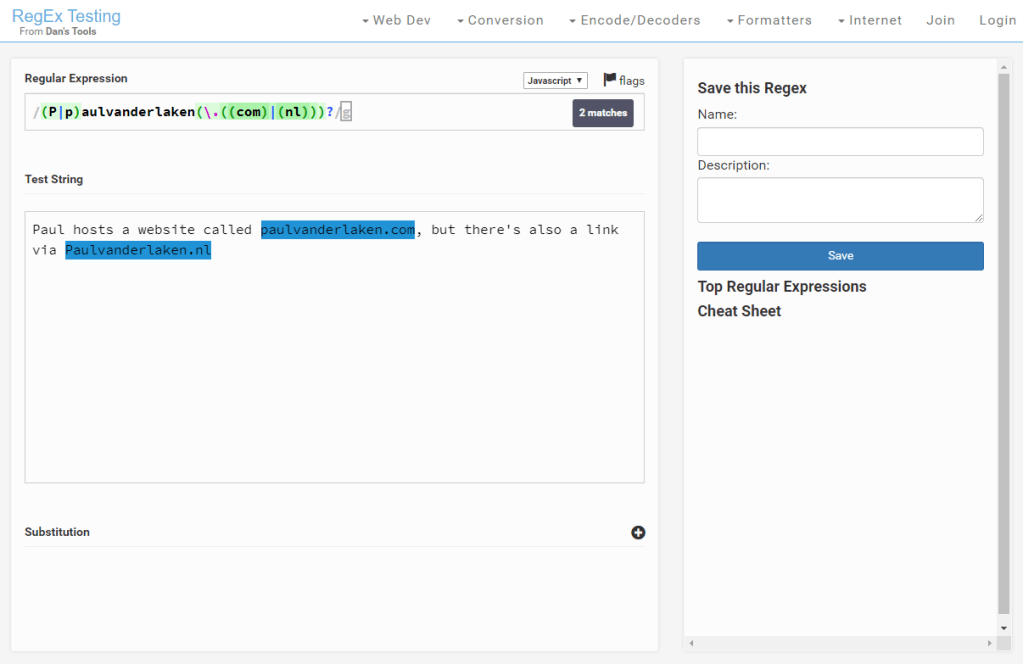
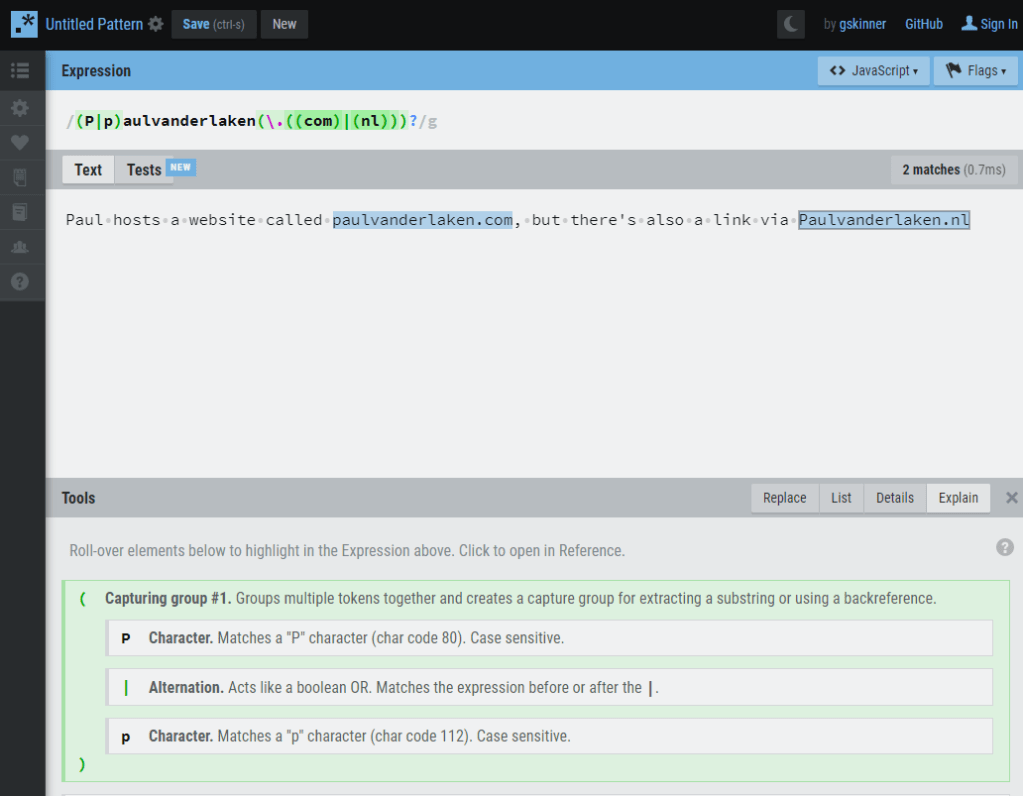
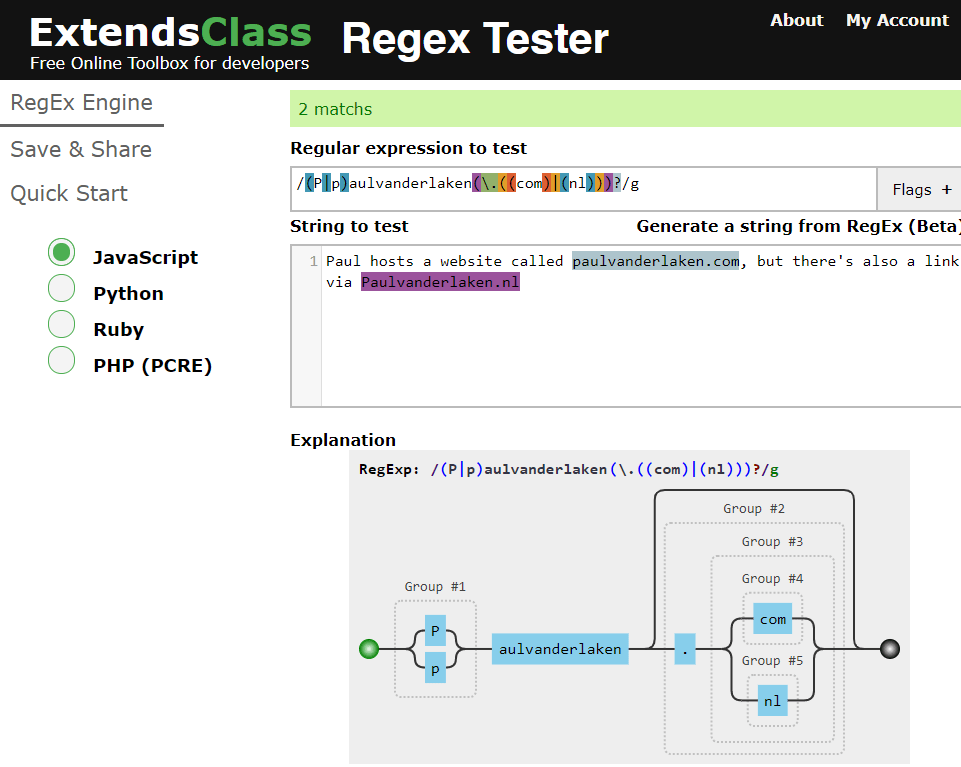
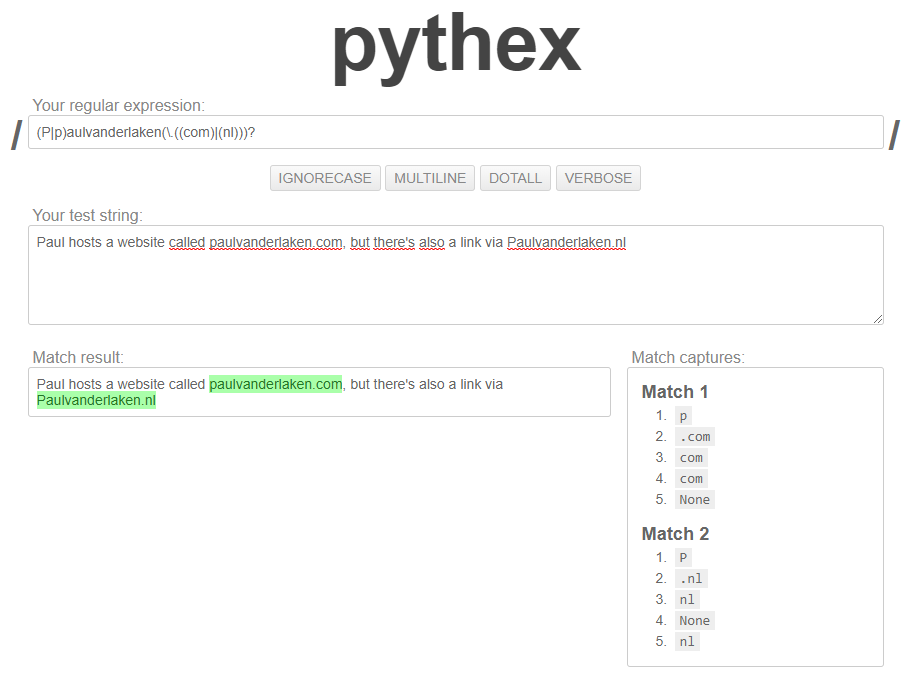
Regular expression (also abbreviated to regex) really is a powertool any programmer should know. It was and is one of the things I most liked learning, as it provides you with immediate, godlike powers that can speed up your (data science) workflow tenfold.
I’ve covered many regex related topics on this blog already, but thought I’d combine them and others in a nice curated overview — for myself, and for you of course, to use.
If you have any materials you liked, but are missing, please let me know!
Sometimes I find these AI / programming hobby projects that I just wished I had thought of…
Will Stedden combined OpenAI’s GPT-2 deep learning text generation model with another deep-learning language model by Google called BERT (Bidirectional Encoder Representations from Transformers) and created an elaborate architecture that had one purpose: posting the best replies on Reddit.
The architecture is shown at the end of this post — copied from Will’s original bloghere. Moreover, you can read this post for details regarding the construction of the system. But let me see whether I can explain you what it does in simple language.
The below is what a Reddit comment and reply thread looks like. We have str8cokane making a comment to an original post (not in the picture), and then tupperware-party making a reply to that comment, followed by another reply by str8cokane. Basically, Will wanted to create an AI/bot that could write replies like tupperware-party that real people like str8cokane would not be able to distinguish from “real-people” replies.
Note that with 4 points, str8cokane‘s original comments was “liked” more than tupperware-party‘s reply and str8cokane‘s next reply, which were only upvoted 2 and 1 times respectively.
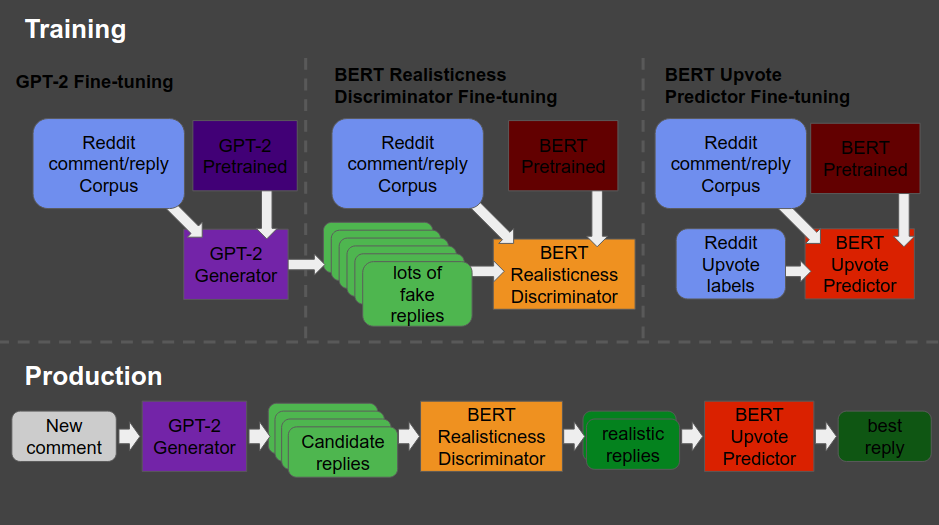
So here’s what the final architecture looks like, and my attempt to explain it to you.
Basically, we start in the upper left corner, where Will uses a database (i.e. corpus) of Reddit comments and replies to fine-tune a standard, pretrained GPT-2 model to get it to be good at generating (red: “fake”) realistic Reddit replies.
Next, in the upper middle section, these fake replies are piped into a standard, pretrained BERT model, along with the original, real Reddit comments and replies. This way the BERT model sees both real and fake comments and replies. Now, our goal is to make replies that are undistinguishable from real replies. Hence, this is the task the BERT model gets. And we keep fine-tuning the original GPT-2 generator until the BERT discriminator that follows is no longer able to distinguish fake from real replies. Then the generator is “fooling” the discriminator, and we know we are generating fake replies that look like real ones! You can find more information about such generative adversarial networks here.
Next, in the top right corner, we fine-tune another BERT model. This time we give it the original Reddit comments and replies along with the amount of times they were upvoted (i.e. sort of like likes on facebook/twitter). Basically, we train a BERT model to predict for a given reply, how much likes it is going to get.
Finally, we can go to production in the lower lane. We give a real-life comment to the GPT-2 generator we trained in the upper left corner, which produces several fake replies for us. These candidates we run through the BERT discriminator we trained in the upper middle section, which determined which of the fake replies we generated look most real. Those fake but realistic replies are then input into our trained BERT model of the top right corner, which predicts for every fake but realistic reply the amount of likes/upvotes it is going to get. Finally, we pick and reply with the fake but realistic reply that is predicted to get the most upvotes!
What Will’s final architecture, combining GPT-2 and BERT, looked like (via bonkerfield.org)
The results are astonishing! Will’s bot sounds like a real youngster internet troll! Do have a look at the original blog, but here are some examples. Note that tupperware-party — the Reddit user from the above example — is actually Will’s AI.
Will ends his blog with a link to the tutorial if you want to build such a bot yourself. Have a try!
Moreover, he also notes the ethical concerns:
I know there are definitely some ethical considerations when creating something like this. The reason I’m presenting it is because I actually think it is better for more people to know about and be able to grapple with this kind of technology. If just a few people know about the capacity of these machines, then it is more likely that those small groups of people can abuse their advantage.
I also think that this technology is going to change the way we think about what’s important about being human. After all, if a computer can effectively automate the paper-pushing jobs we’ve constructed and all the bullshit we create on the internet to distract us, then maybe it’ll be time for us to move on to something more meaningful.
If you think what I’ve done is a problem feel free to email me , or publically shame me on Twitter.
Most data scientists favor Python as a programming language these days. However, there’s also still a large group of data scientists coming from a statistics, econometrics, or social science and therefore favoring R, the programming language they learned in university. Now there’s a new kid on the block: Julia.
According to some, you can think of Julia as a mixture of R and Python, but faster. As a programming language for data science, Julia has some major advantages:
Julia is light-weight and efficient and will run on the tiniest of computers
Julia is just-in-time (JIT) compiled, and can approach or match the speed of C
Julia is a functional language at its core
Julia support metaprogramming: Julia programs can generate other Julia programs
Julia has a math-friendly syntax
Julia has refined parallelization compared to other data science languages
Julia can call C, Fortran, Python or R packages
However, others also argue that Julia comes with some disadvantages for data science, like data frame printing, 1-indexing, and its external package management.
Comparing Julia to Python and R
Open Risk Manual published this side-by-side review of the main open source Data Science languages: Julia, Python, R.
You can click the links below to jump directly to the section you’re interested in. Once there, you can compare the packages and functions that allow you to perform Data Science tasks in the three languages.
Here’s a very well written Medium article that guides you through installing Julia and starting with some simple Data Science tasks. At least, Julia’s plots look like:
As I wrote about Project Euler and CodingGame before, someone recommended me CodeWars. CodeWars offers free online learning exercises to develop your programming skills through fun daily challenges.
In line with Project Euler, you are tasked with solving increasingly complex programming challenges. At CodeWars, these little problems you need to solve with code are called kata.
Kata take a test-driven development approach: the programs you write need to pass the tests of the developer who made the kata in the first place. Only then are you awarded with honour and can you earn your ranks and progress to the more complex kata.
Sounds fun right? I’m definitely going to check this out, as they support a wide range of programming languages, each with many kata to solve!
Python, Ruby, C++, Java, JavaScript and many other main programming languages are already supported, but CodeWards is also still developing kata for more niche or upcoming languages like R, Lua, Kotlin, and Scala.