Both in science and business, we often experience difficulties collecting enough data to test our hypotheses, either because target groups are small or hard to access, or because data collection entails prohibitive costs.
Such obstacles may result in data sets that are too small for the complexity of the statistical model needed to answer the questions we’re really interested in.
This unique book provides guidelines and tools for implementing solutions to issues that arise in small sample studies. Each chapter illustrates statistical methods that allow researchers and analysts to apply the optimal statistical model for their research question when the sample is too small.
This book will enable anyone working with data to test their hypotheses even when the statistical model required for answering their questions are too complex for the sample sizes they can collect. The covered statistical models range from the estimation of a population mean to models with latent variables and nested observations, and solutions include both classical and Bayesian methods. All proposed solutions are described in steps researchers can implement with their own data and are accompanied with annotated syntax in R.
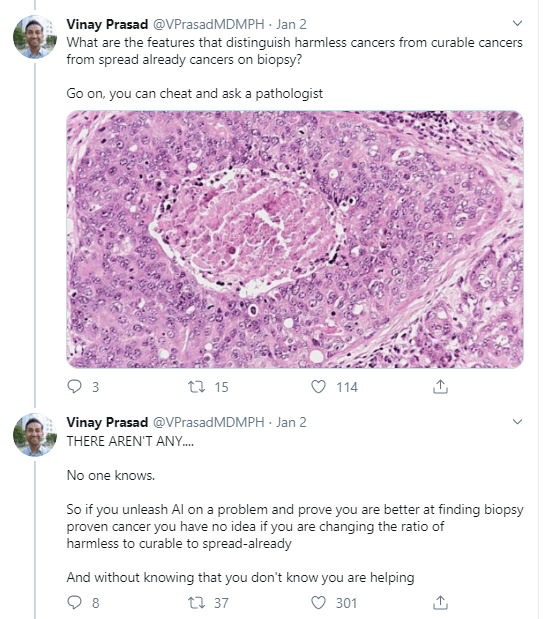
I came across this opinionated though informed commentary by Vinay Prasad on the recent Nature article where Google’s machine learning experts trained models to predict whether scans of patients’ breasts (mammogram’s) show cancerous cells or not.
Vinay Prasad [official bio] is a practicing hematologist-oncologist and Associate Professor of Medicine at Oregon Health and Science University. So he knows what he’s talking about.
He argues that “cancer screening is the LAST thing you should pick FIRST to work on with AI”. Which is an interesting statement in and of itself.
Regardless of my personal opinion on the topic, I found the paper, Vinay’s commentary, and the broader discussion on twitter very interesting and educational to read. I feel it shows how important it is to know the context in which you are applying machine learning. What tremendous value it provides to have domain experts in the same team as the data and machine learning experts.
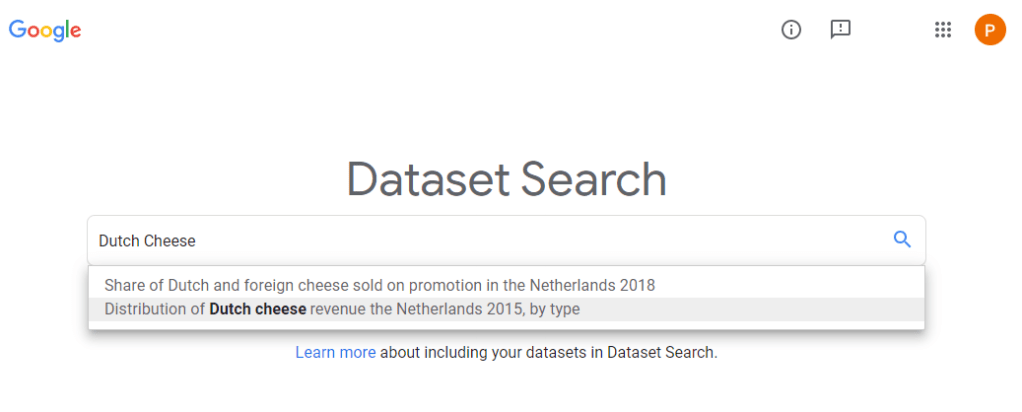
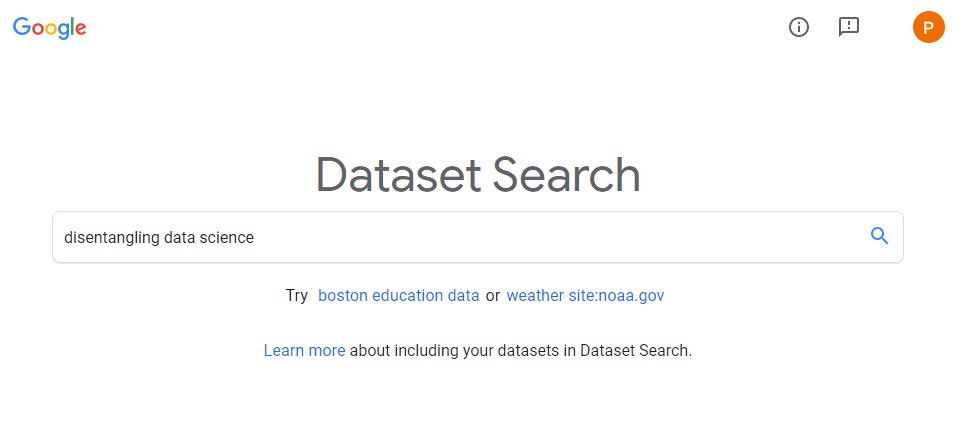
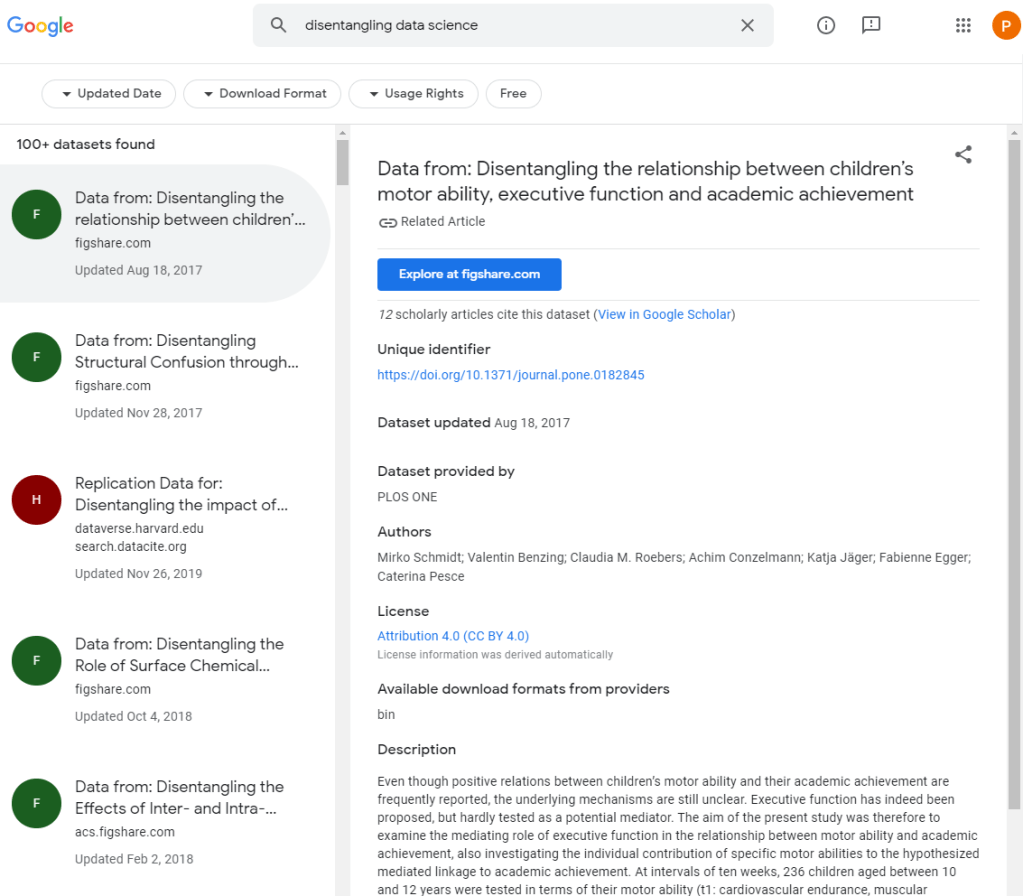
The “world wide web” hosts millions of datasets, on nearly any topic you can think of. Google’s Dataset Search has indexed almost 25 million of these datasets, giving you a single entry point to search for datasets online. After a year of testing, Dataset Search is now officially out of beta.
After alpha testing, Dataset Search now includes filter based on the types of dataset that you want (e.g., tables, images, text), on whether the dataset is open source/access. For dataset on geographic area’s, you can see the map. The quality of dataset’s descriptions has improved greatly, and the tool now has a mobile version.
Reddit is a treasure trove of random stuff. However, every now and then, in the better groups, quite valuable topics pop up. Here’s one I came across on r/statistics:
Particularly the advice by grandzooby seemed worth a like, and he linked to several useful resources which I’ve summarized for you below.
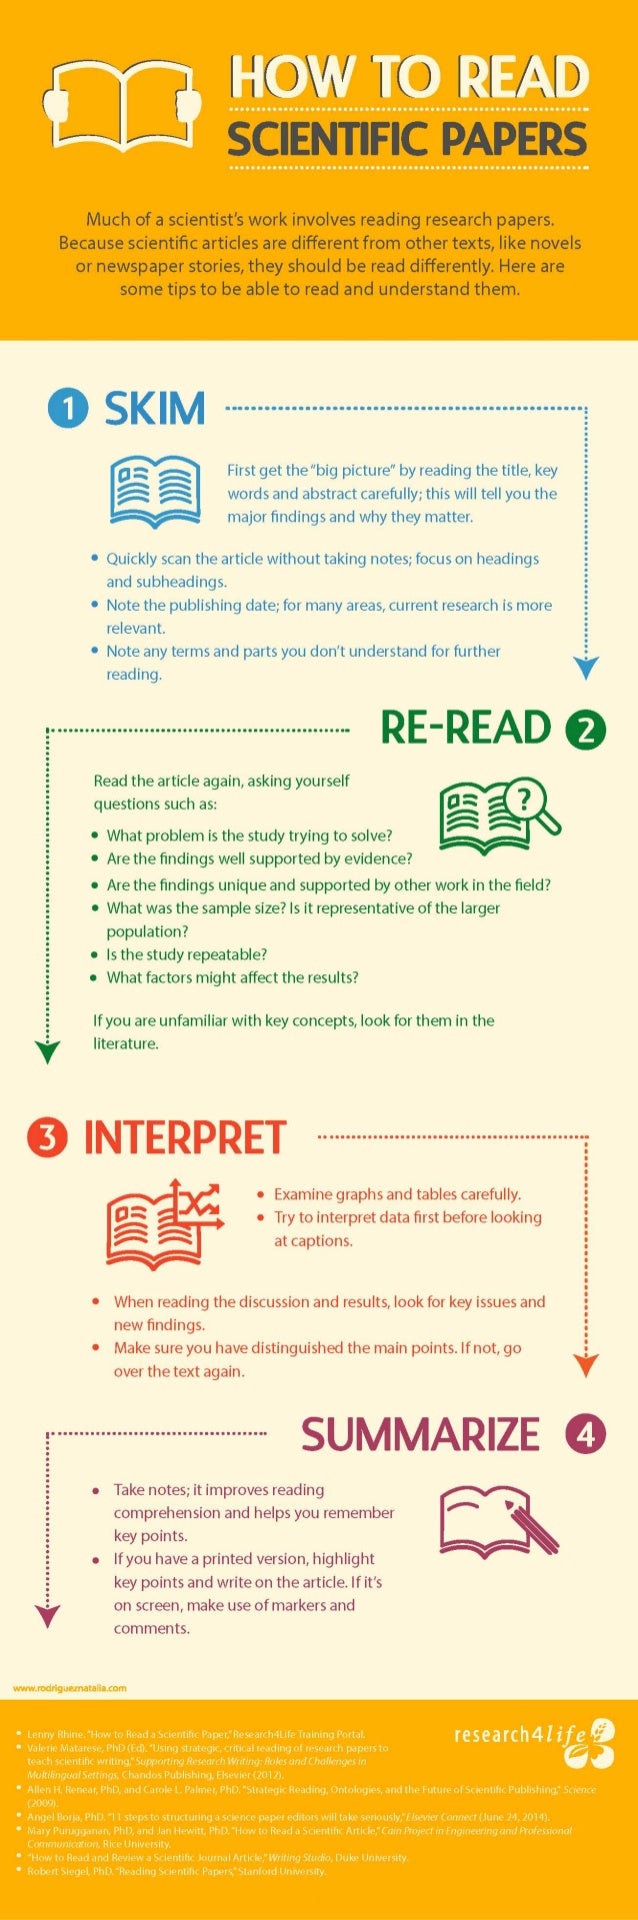
An 11-step guide to reading a paper
Jennifer Raff — assistant professor at the University of Kansas — wrote this 3-page guide on how to read papers. It elaborates on 11 main pieces of advice for reading academic papers:
Begin by reading the introduction, skip the abstract.
Identify the general problem: “What problem is this research field trying to solve?”
Try to uncover the reason and need for this specific study.
Identify the specific problem: “What problems is this paper trying to solve?”
Identify what the researchers are going to do to solve that problem
Read & identify the methods: draw the studies in diagrams
Read & identify the results: write down the main findings
Determine whether the results solve the specific problem
Read the conclusions and determine whether you agree
Mary Purugganan and Jan Hewitt of Rice University propose slightly different steps for reading academic papers. Though they seem more general pointers to keep in mind to me:
Skim the article and identify its structure
Distinguish its main points
Generate questions before and during reading
Draw inferences while reading
Take notes while reading
Regarding the note taking Mary and Jan propose the following template which may proof useful:
Citation:
URL:
Keywords:
General subject:
Specific subject:
Hypotheses:
Methodology:
Results:
Key points:
Context (in the broader field/your work):
Significance (to the field/your work):
Important figures/tables (description/page numbers):
References for further reading:
Other comments:
Scholars sharing their experiences
Science Magazine dedicated a long read to how to seriously read scientific papers, in which they asked multiple scholars to share their experiences and tips.
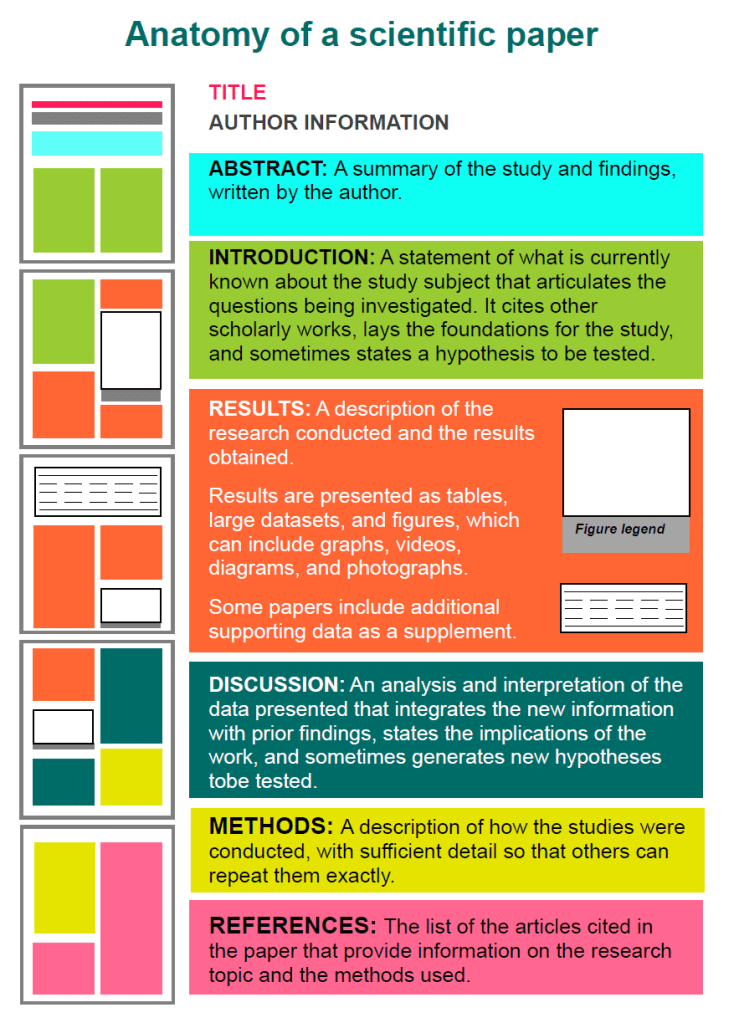
Anatomy of a scientific paper
This 13-page guide by the American Society of Plant Biologists was recommended by some, but I personally don’t find it as useful as the other advices here. Nevertheless, for the laymen, it does include a nice visualization of the anatomy of scientific papers:
This course gives you easy access to the invaluable learning techniques used by experts in art, music, literature, math, science, sports, and many other disciplines. We’ll learn about the how the brain uses two very different learning modes and how it encapsulates (“chunks”) information. We’ll also cover illusions of learning, memory techniques, dealing with procrastination, and best practices shown by research to be most effective in helping you master tough subjects.
Last week I cohosted a professional learning course on data visualization at JADS. My fellow host was prof. Jack van Wijk, and together we organized an amazing workshop and poster event. Jack gave two lectures on data visualization theory and resources, and mentioned among others treevis.net, a resource I was unfamiliar with up until then.
treevis.net is a lot like the dataviz project in the sense that it is an extensive overview of different types of data visualizations. treevis is unique, however, in the sense that it is focused on specifically visualizations of hierarchical data: multi-level or nested data structures.
Hans-Jörg Schulz — professor of Computer Science at Aarhus University in Denmark — maintains the treevis repo. At the moment of writing, he has compiled over 300 different types of hierachical data visualizations and displays them on this website.
As an added bonus, the repo is interactive as there are several ways to filter and look for the visualization type that best fits your data and needs.
Most resources come with added links to the original authors and the original papers they were first published in, so this is truly a great resources for those interested in doing a deep dive into data visualization. Do have a look yourself!
The repository consists of tools for multiple languages (R, Python, Matlab, Java) and resources in the form of:
Books & Academic Papers
Online Courses and Videos
Outlier Datasets
Algorithms and Applications
Open-source and Commercial Libraries/Toolkits
Key Conferences & Journals
Outlier Detection (also known as Anomaly Detection) is an exciting yet challenging field, which aims to identify outlying objects that are deviant from the general data distribution. Outlier detection has been proven critical in many fields, such as credit card fraud analytics, network intrusion detection, and mechanical unit defect detection.