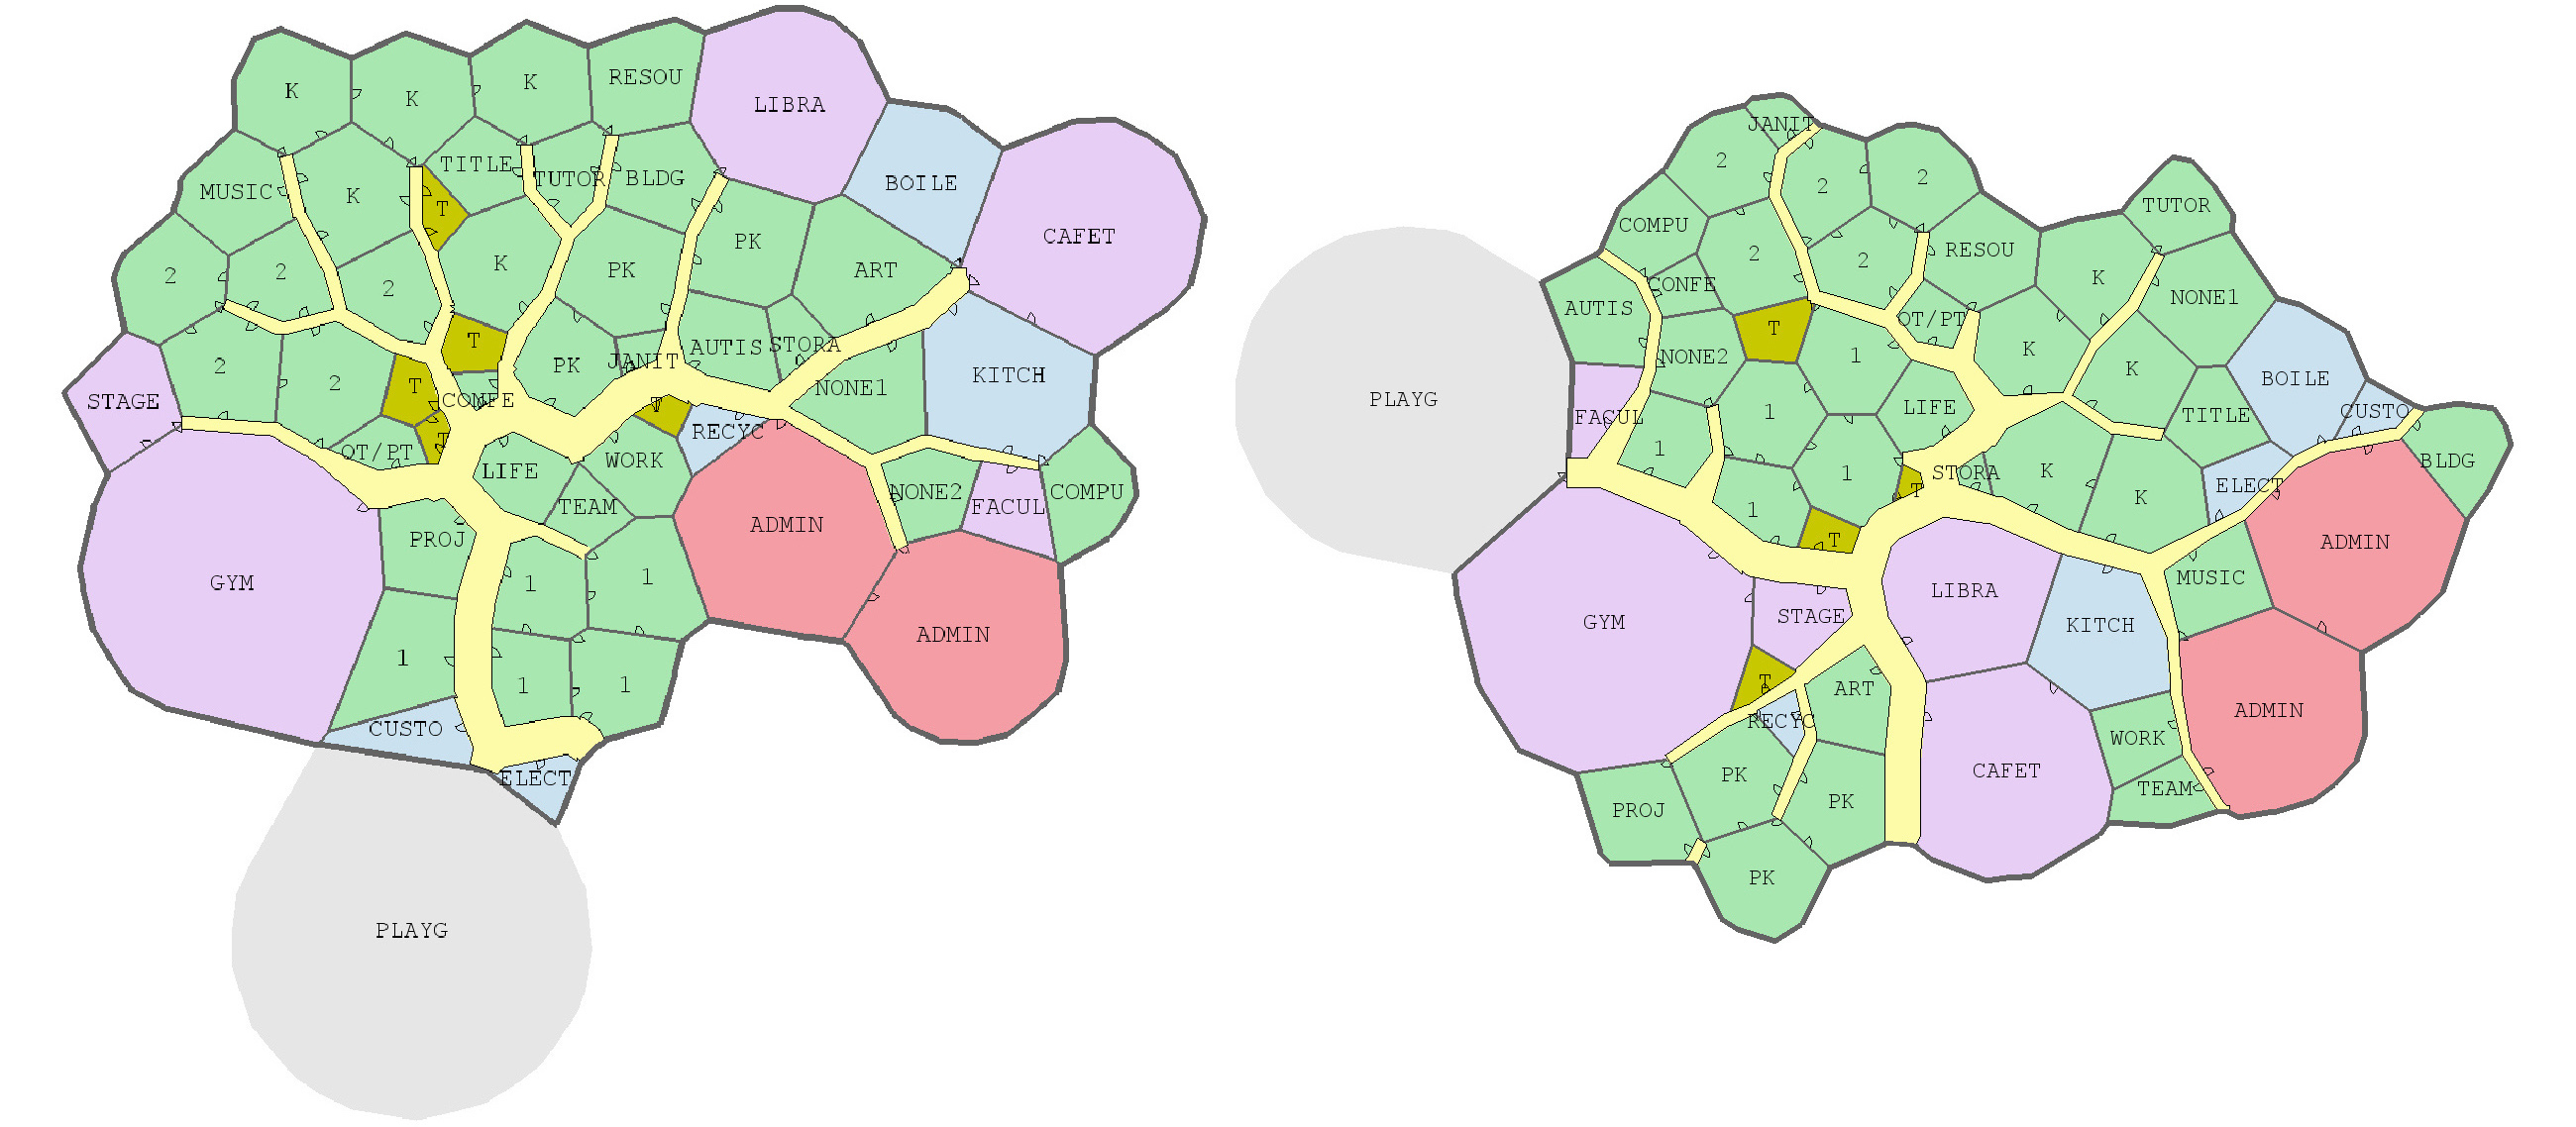
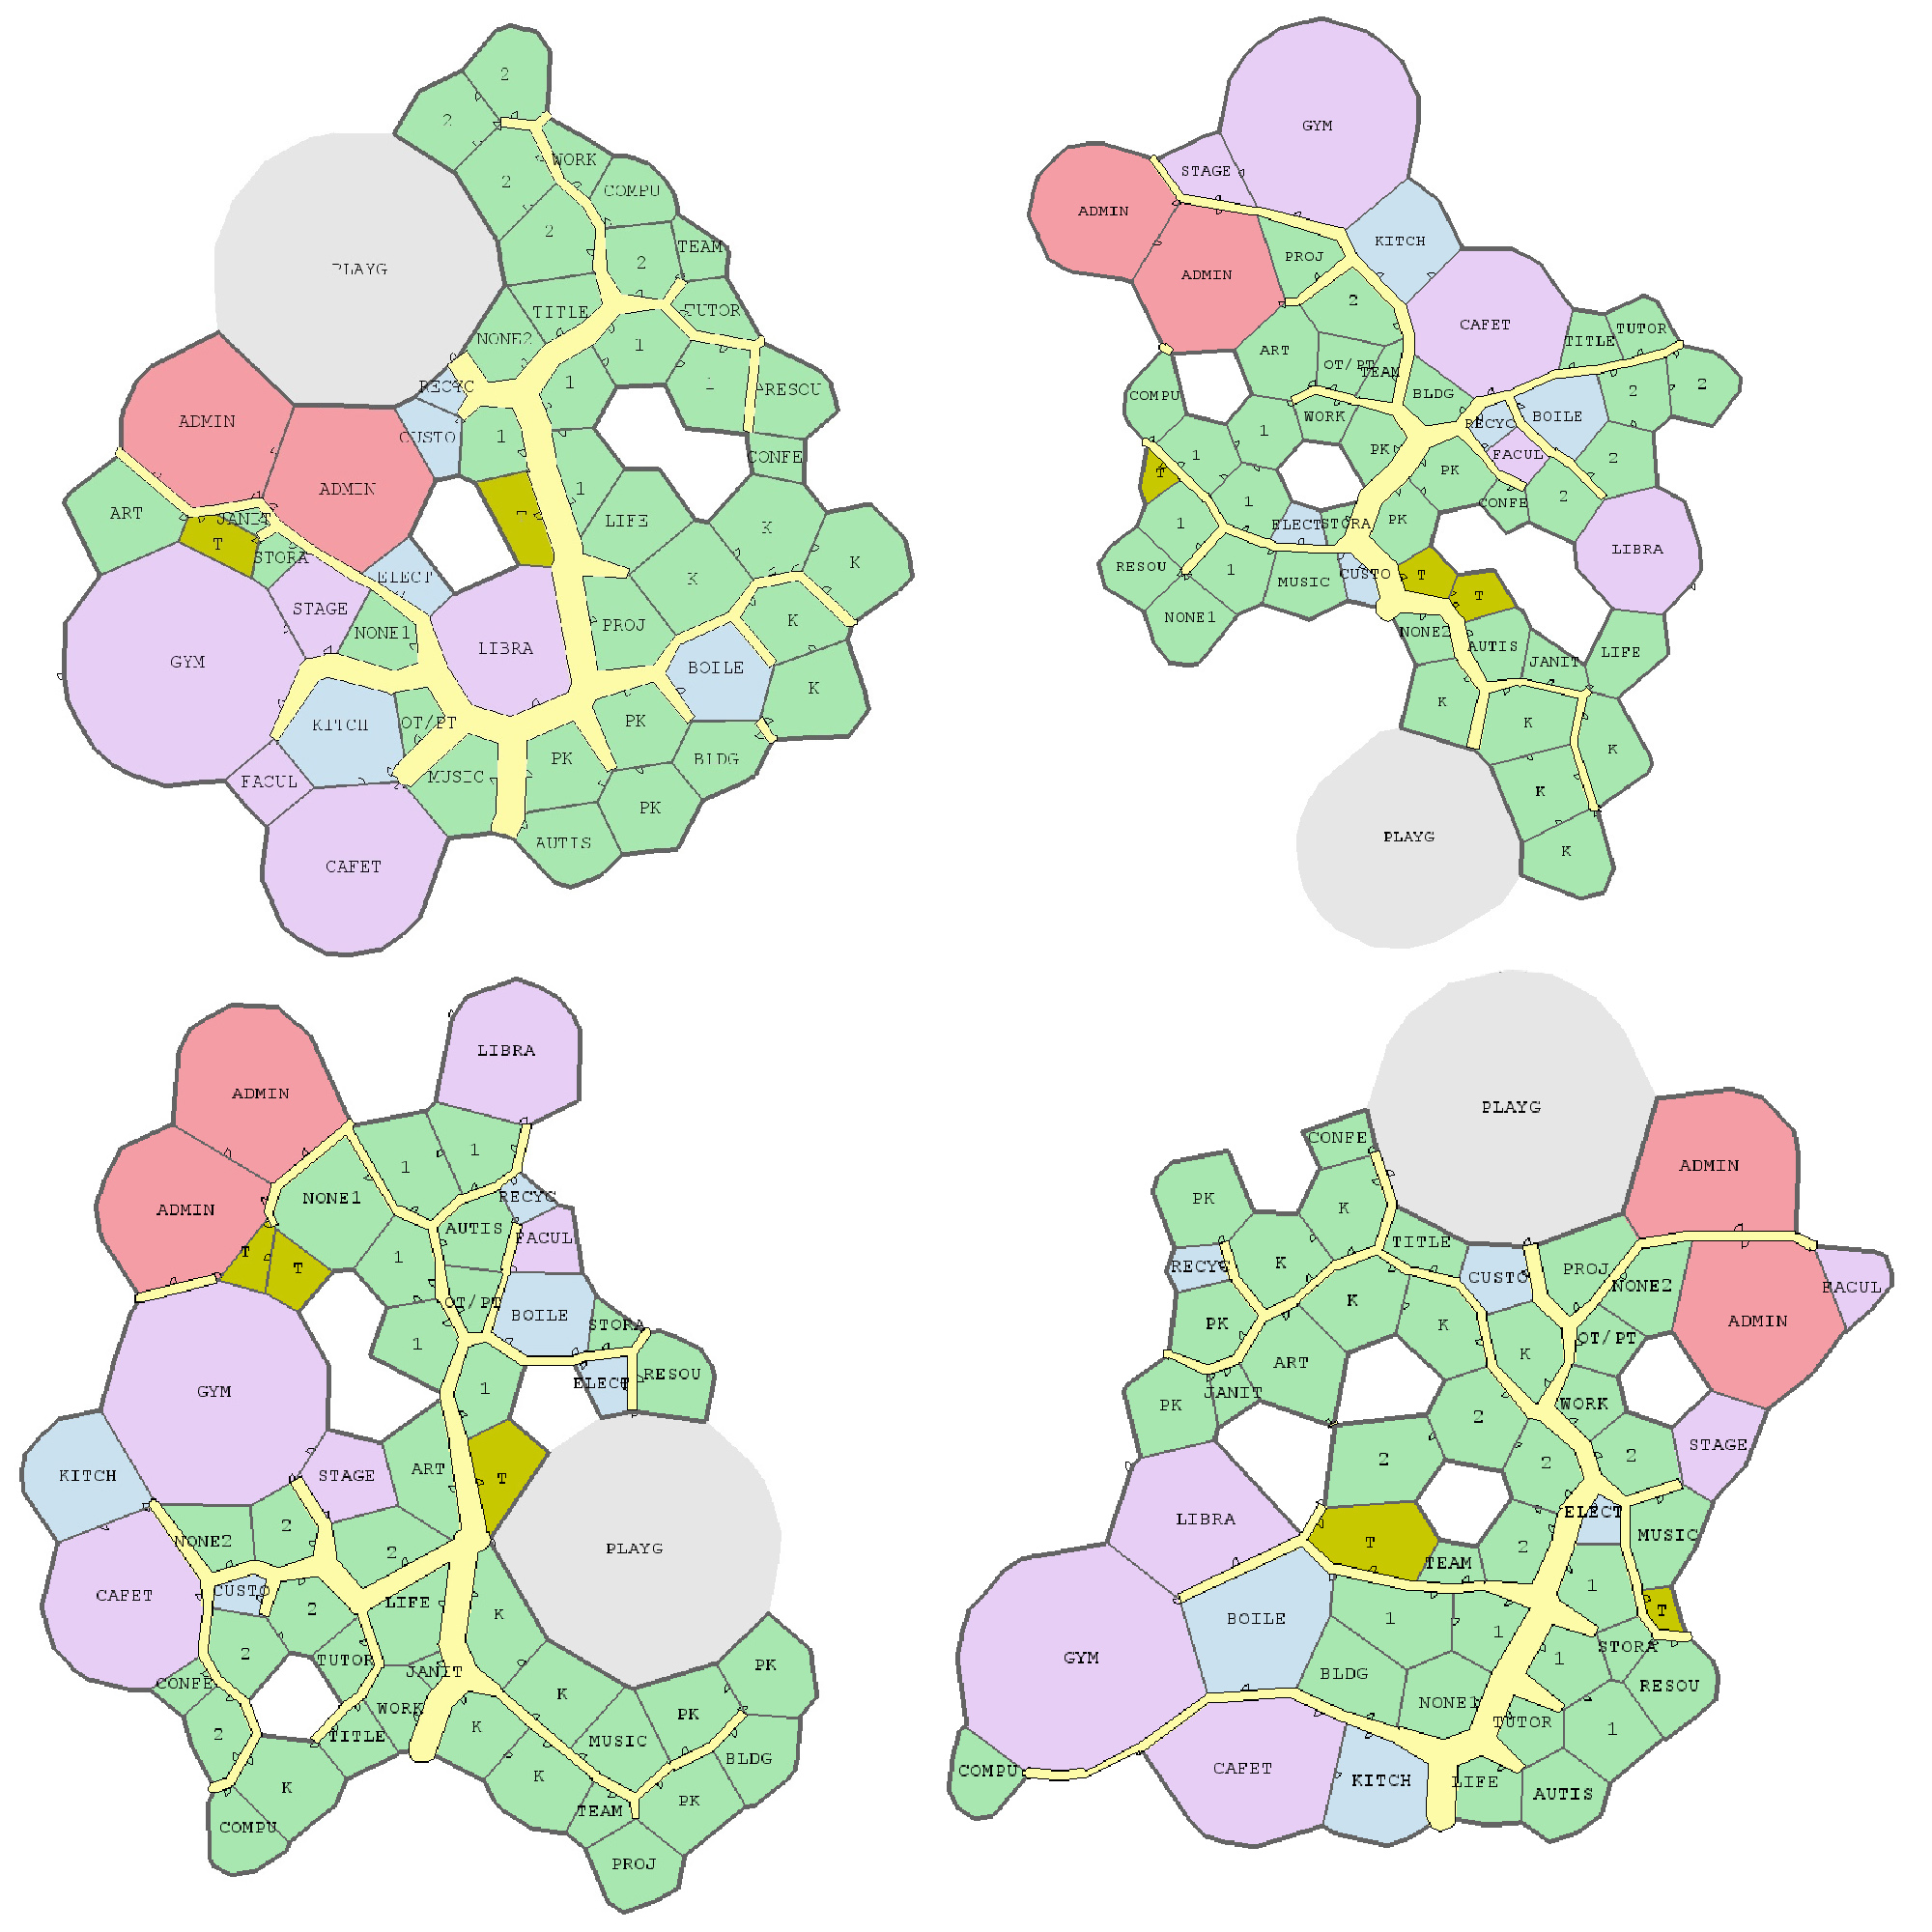
Joel Simon is the genius behind an experimental project exploring optimized school blueprints. Joel used graph-contraction and ant-colony pathing algorithms as growth processes, which could generate elementary school designs optimized for all kinds of characteristics: walking time, hallway usage, outdoor views, and escape routes just to name a few.
Two generated designs, minimizing the traffic flow (left) as well as escape routes (right) [original]Other designs tried to maximize the number of windows, resulting in seemingly random open courtyards [original]
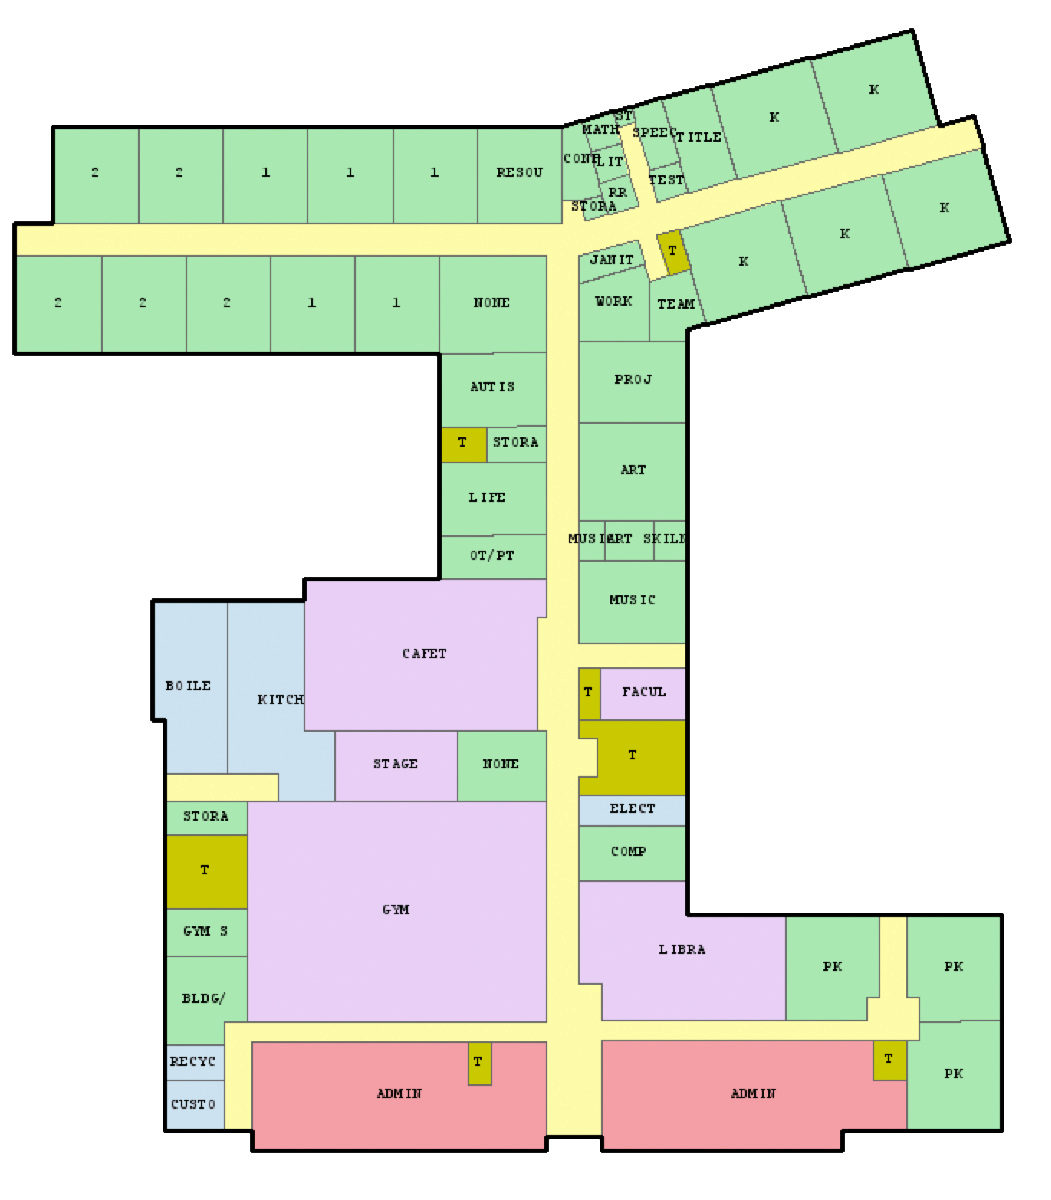
The original floor plan [original]Definitely check out the original write-up if you are interested in the details behind the generation process! Or have a look at some of Joel’s other projects.
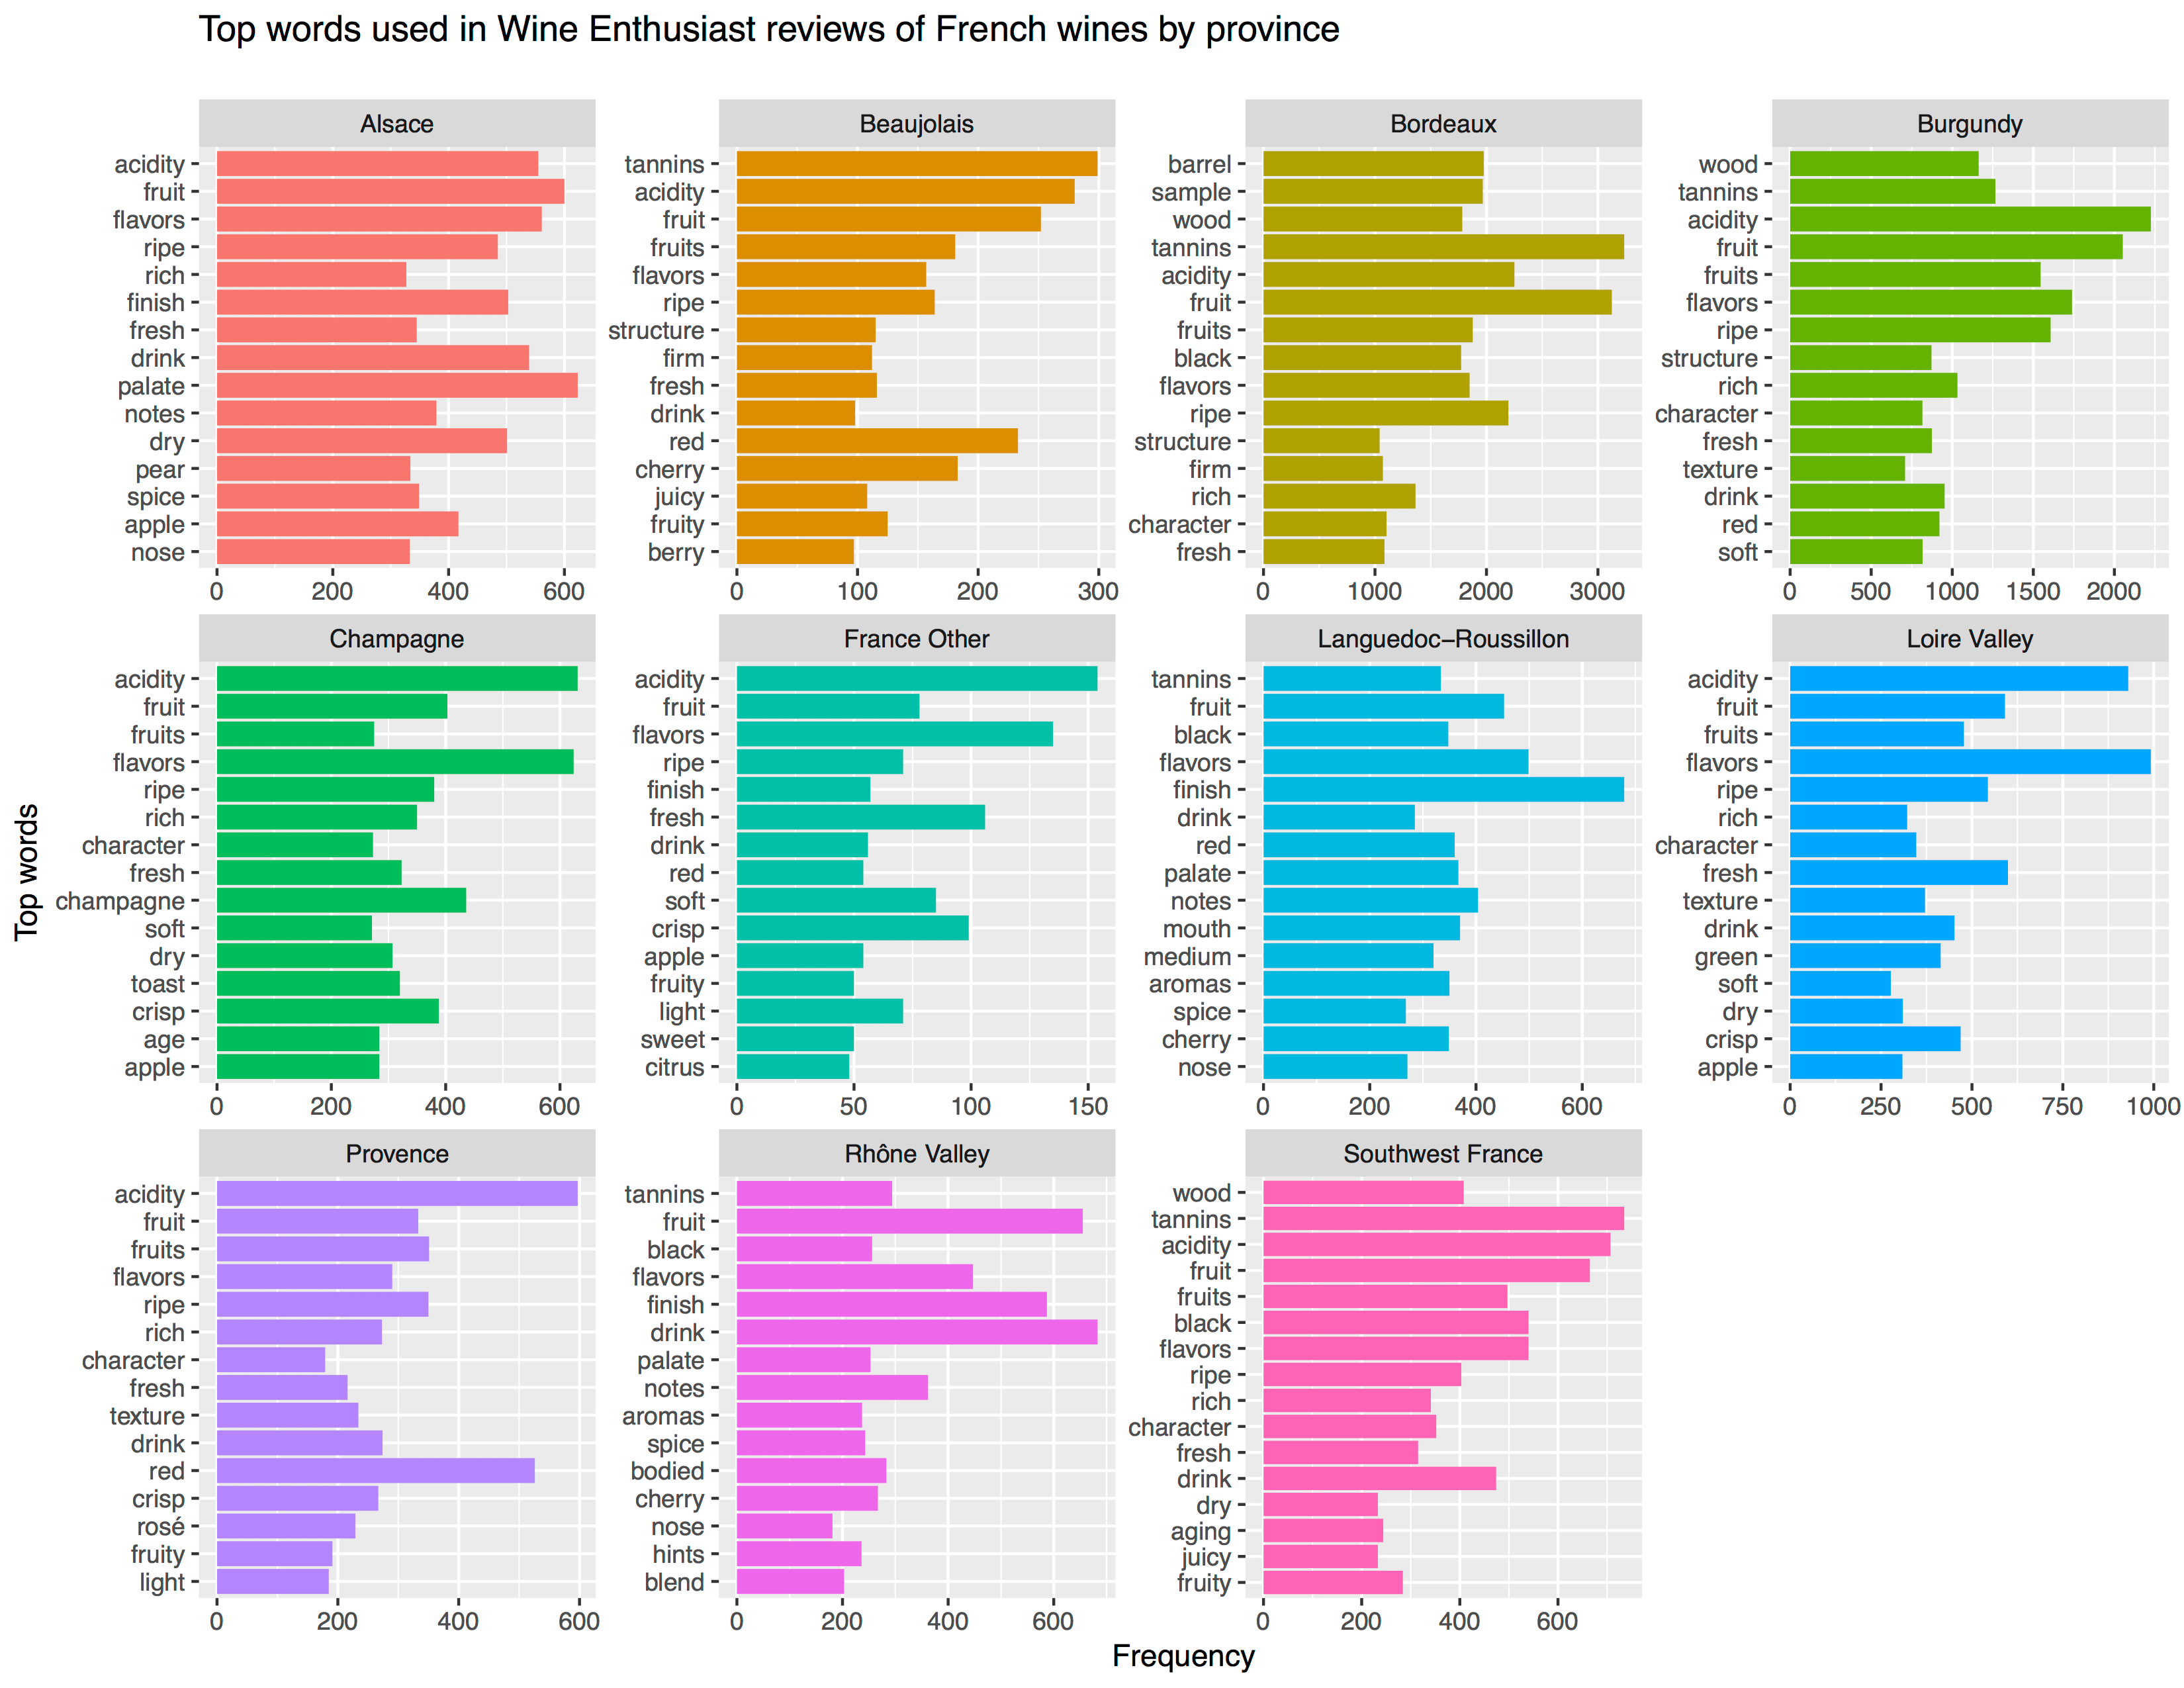
Aleszu Bajak at Storybench.org published a great demonstration of the power of text mining. He used the R tidytext package to analyse 150,000 wine reviews which Zach Thoutt had scraped from Wine Enthusiast in November of 2017.
Aleszu started his analysis on only the French wines, with a simple word count per region:
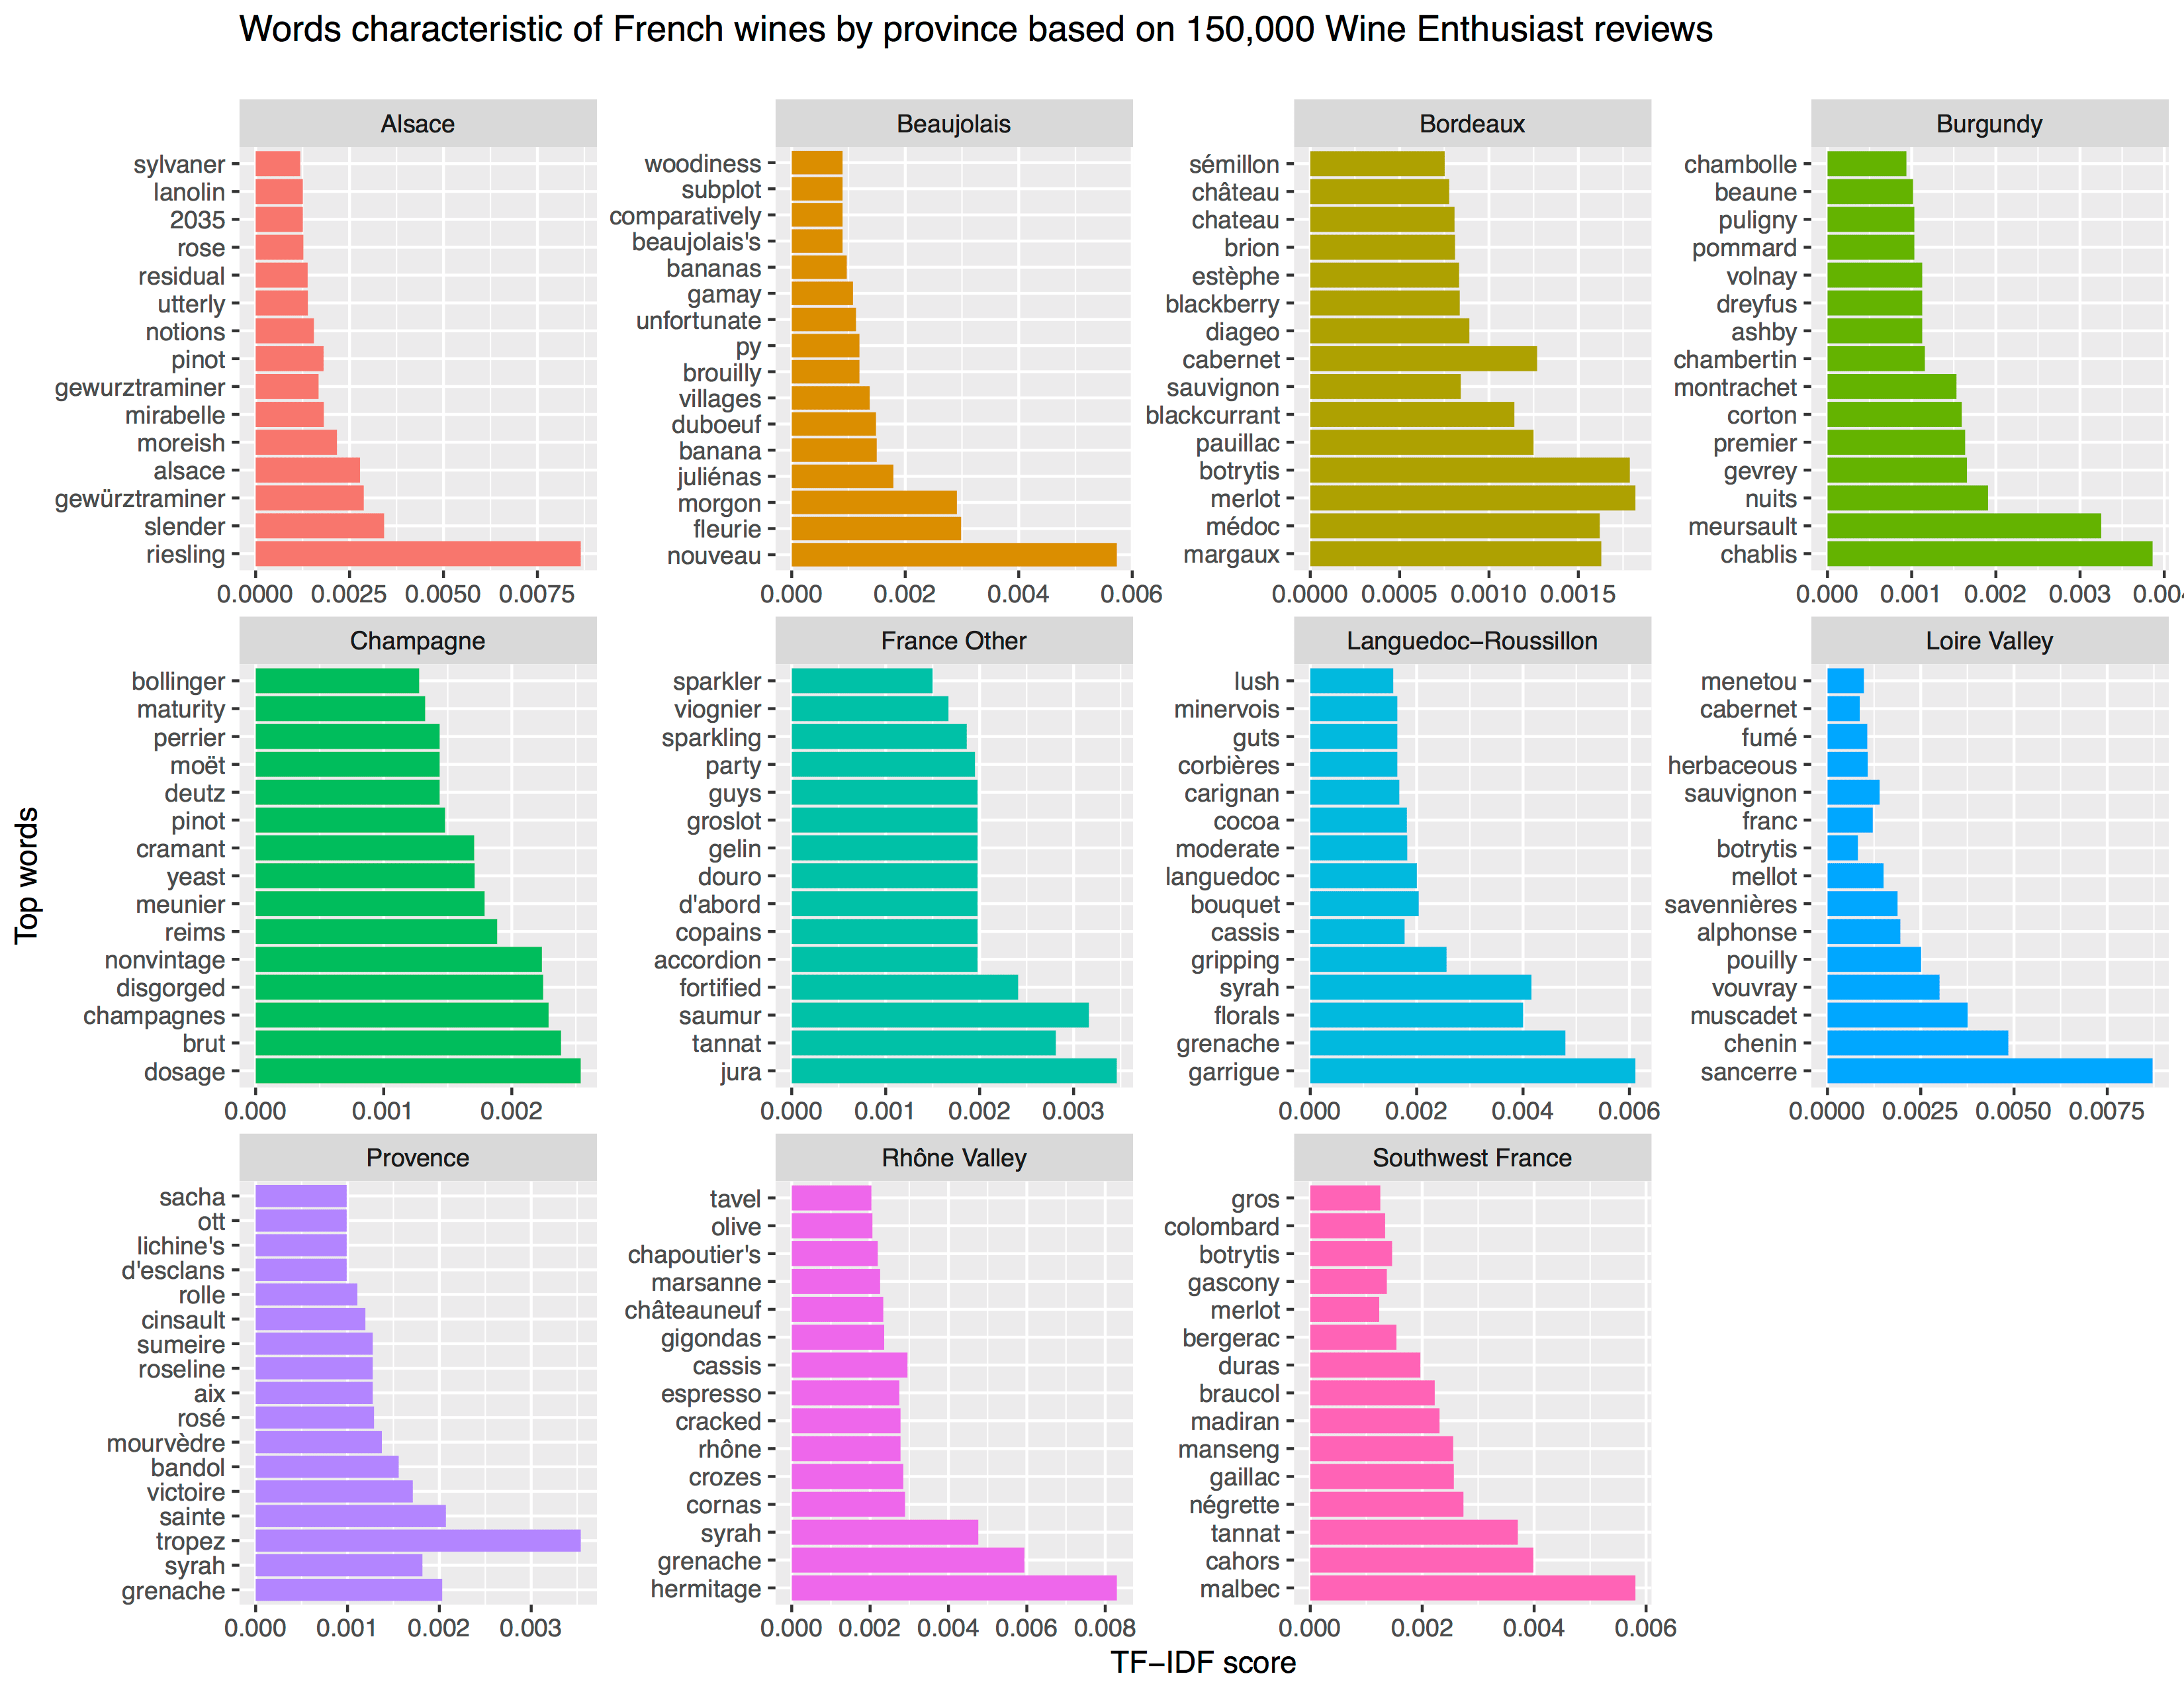
[orginal blog]Next, he applied TF-IDF to surface the words that are most characteristic for specific French wine regions — words used often in combination with that specific region, but not in relation to other regions.
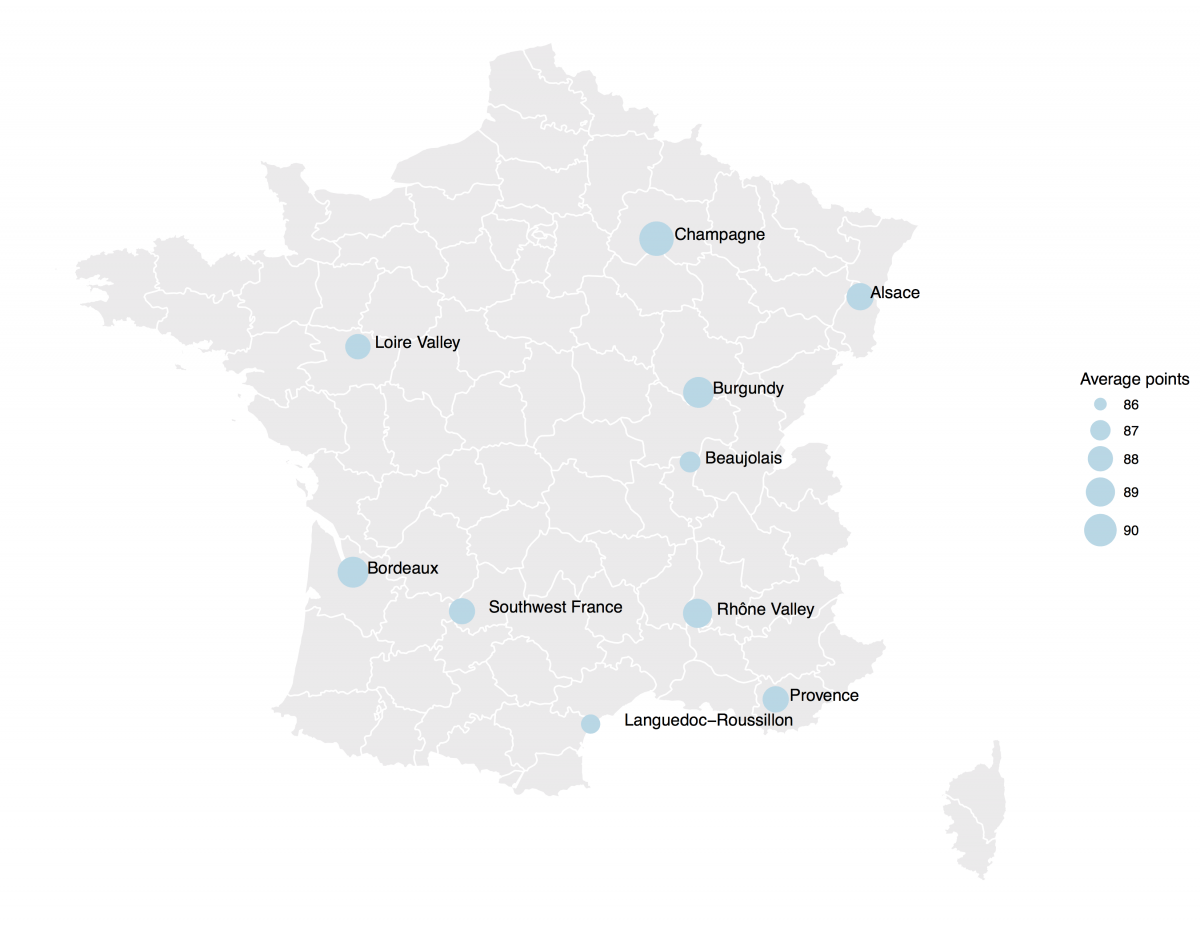
[orginal blog]The data also contained some price information, which Aleszu mapped France with ggplot2 and the maps package to demonstrate which French wine regions are generally more costly.
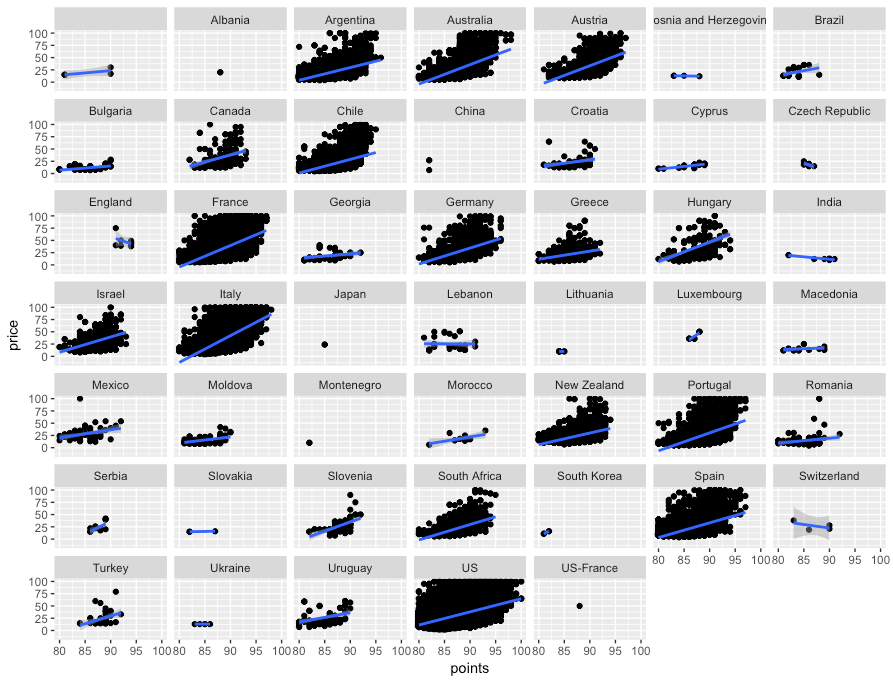
[orginal blog]On the full dataset, Alezsu also demonstrated that there is a strong relationship between price and points, meaning that, in general, more expensive wines seem to get better reviews:
Nothing beats a aesthetically-pleasing data visualization in the form of a map (see evidence here, here, here, or here).
Moreover, we’ve already witnessed some great R tutorials by Ilya Kashnitsky before (see Animated Snow in R).
These two come together in Ilya’s recent post on subplots in ggplot2 maps, with which he completely amazed me. The creation process is actually easier than the end result makes it look: make several visualizations and add them as ggplot2::annotation_custom() to your main ggplot2 map — the same as if you are adding a logo to your plot. Enjoy:
Disclaimer: This page contains one or more links to Amazon. Any purchases made through those links provide us with a small commission that helps to host this blog.
Useful base functions
str() – explore structure of R object
trimws() – trim trailing and/or leading whitespaces
dput() – dump an R object in form of R code
cut()– categorize values into intervals
intersect() – returns similar elements in two vectors
union() – find intersecting items in two vectors
setdiff() – returns different elements in two vectors
interaction() – computes a factor which represents the interaction of the given factors
formatC()can be used to round numbers and force trailing zero’s
formatC() and sprintf() can be used to add leading/trailing characters
expand.grid() – create a data frame from all combinations of the supplied vectors or factors
seq_along(myvec) – generates a vector of 1:length(myvec)
Generate distributions in ggplot2 using the stat_function function. Normal distributions, student t-distributions, beta distributions, anything. See also here.
Zack Nado wrote the best machine learning application I’ve seen so far: a neural network architecture that generates new Pusheen pictures.
This is an orginal Pusheen picture.
In his blog, Zack describes his generative adversarial network (GAN) , a special type of machine learning architecture where two neural networks try to fool each other. Zack first gave the discriminator network some real Pusheen images, so it gets an idea of what Pusheen looks like. Next, the generator network gets a bunch of random numbers so it can generate completely new (fake) images. These generated images are then fed back into the discriminator, so it knows what generated images look like. Zack repeated this process several hundred thousand times, so he obtained a generator network that’s great at making new Pusheen images which the discriminator (nearly) can’t dinstinguish from the original, real ones. Below is the learning process of the generator network visualized:
Samples output by the generator network. It learns distinctive features of “real” Pusheen (e.g., tail, eyes, ears) over time [original]
In the end, the generated images are very much like the real Pusheen. Zack added an interactive module (using Tensorflow.js) to the blog so you can generate some Pusheens yourself. (it didn’t work for me though…) On a final note, Zack wrote the orginal blog both in plain English, for non-experts, and in jargon, for the more experienced data scientists. I highly recommend you read either one of those versions!
Some of the Pusheen’s generated by Zack’s GAN [original]
Why do groups of people act smart, dumb, kind, or cruel? People behave in strange ways, particularly when they are able to influence one another. Both good and bad things can happen when people interact and behave in network structures. On the bright side, you must be familiar with the wisdom of the crowd, where the aggregated knowledge of a group is more valuable than its sum? Ensemble algorithms – like random forest analysis – rely on this positive principle.
On the dark side, are you familiar with the phenomenon called the tragedy of the commons, where shared resource-systems collapse because individuals behave in their self-interest? Or psychological phenomena such as groupthink, where groups of people make irrational decisions due to social issues? The recent spread of fake news and misinformation is also stimulated by network interactions. In these cases, we could speak of the madness of the crowd.
Nicky Case made a great interactive walkthrough explaining why and when networks of people become wise or mad. You are tasked to change and simulate network interactions while Nicky explains concepts such as (complex) contagion, the majority illusion paradox, bonding and bridging, and small world networks. In the references, Nicky provides links to scientific papers explaining these concepts in more detail. I highly suggest you check out her website here.
Screenshot of one of the explanations/simulations Nicky offers.


