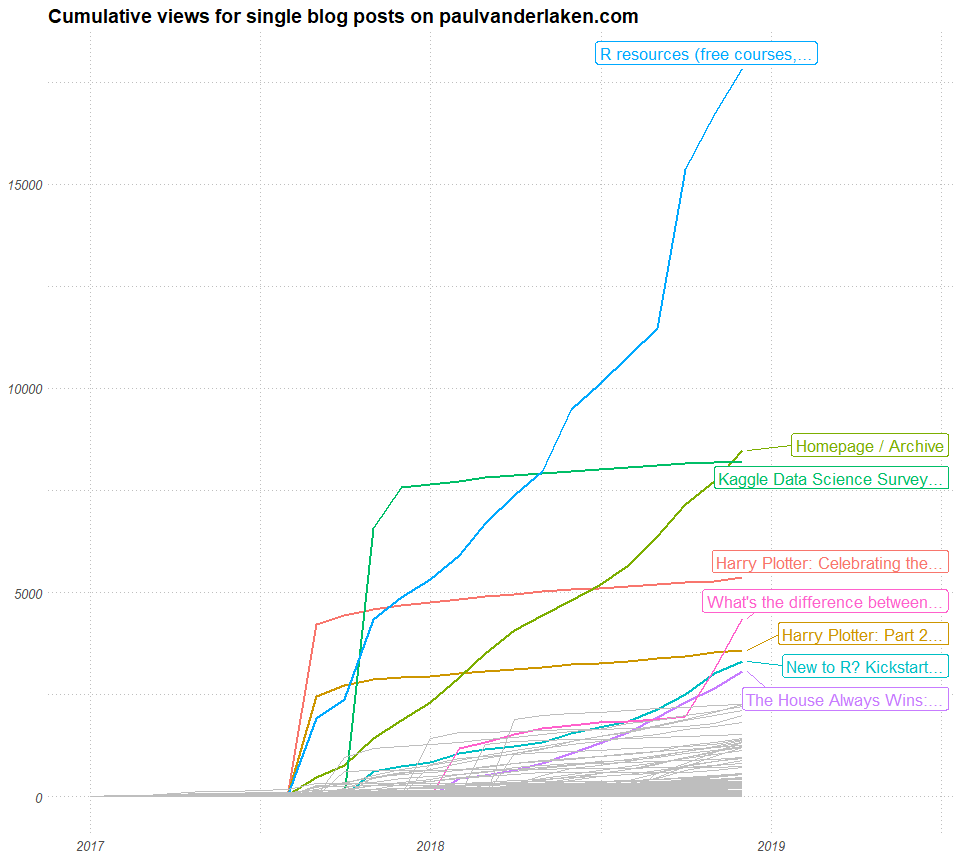
With great pleasure I’ve studied and worked in the field of people analytics, where we seek to leverage employee, management-, and business information to better organize and manage our personnel. Here, data has proven valuable itself indispensible for the organization of the future.
Data and analytics have not traditionally been high on the list of HR professionals. Fortunately, there is an increased awareness that the 21st century (HR) manager has to be data-savvy. But where to start learning? The plentiful available resources can be daunting…
Have a look at these 100+ amazing books
for (starting) people analytics specialists.
My personal recommendations are included as pictures,
but feel free to ask for more detailed suggestions!
Categories (clickable)
- Behavioural Psychology: focus on behavioural psychology and economics, including decision-making and the biases therein.
- Technology: focus on the implications of new technology….
- Ethics: … on society and humanity, and what can go wrong.
- Digital & Data-driven HR: … for the future of work, workforce, and organization. Includes people analytics case studies.
- Management: focus on industrial and organizational psychology, HR, leadership, and business strategy.
- Statistics: focus on the technical books explaining statistical concepts and applied data analysis.
- People analytics: …. more technical books on how to conduct people analytics studies step-by-step in (statistical) software.
- Programming: … technical books specifically aimed at (statistical) programming and data analysis.
- Communication: focus on information exchange, presentation, and data visualization.
Disclaimer: This page contains one or more links to Amazon.
Any purchases made through those links provide us with a small commission that helps to host this blog.
Behavioural Psychology books
- Nudge: Improving Decision About Health, Wealth, and Happiness — by Richard Thaler
- Outliers: The Story of Success — by Malcolm Gladwell
- Predictably Irrational: The Hidden Forces That Shape Our Decisions — by Dan Ariely
- The Halo Effect: . . . and the Eight Other Business Delusions That Deceive Managers — by Phil Rosenzweig
- The Honest Truth About Dishonesty: How We Lie to Everyone — Especially Ourselves — by Dan Ariely
- The Person You Mean to Be: How Good People Fight Bias — by Dolly Chugh
- The Undoing Project: A Friendship That Changed Our Minds — by Michael Lewis
- Thinking, Fast and Slow — by Daniel Kahneman
- Superforecasters: The Art and Science of Prediction — by Philip Tetlock and Dan Gardner


Technology books
- Algorithms to Live By: The Computer Science of Human Decisions — by Brian Christian and Tom Griffeth
- Business Analytics for Managers: Taking Business Intelligence Beyond Reporting — by Gert Laursen
- Competing on Analytics: The Science of Winning — by Thomas Davenport and Jeanne Harris
- Data Science for Business: What You Need to Know about Data Mining and Data-Analytic Thinking — by Foster Provost and Tom Fawcett
- Moneyball: The Art of Winning At An Unfair Game — by Michael Lewis
- Only Humans Need Apply: Winners and Losers in the Age of Smart Machines — by Thomas Davenport
- Predicting Business Success: Using Smarter Analytics to Drive Results — by Scott Mondore, Hannah Spell, Matt Betts, and Shane Douthitt
- Predictive Analytics for Human Resources — by Jac Fitz-Enz and John Mattox
- Predictive Analytics: The Power to Predict Who Will Click, Buy, Lie, or Die — by Eric Siegel
- Rise of the Robots: Technology and the Threat of a Jobless Future — by Martin Ford
- The Inevitable: Understanding the 12 Technological Forces That Will Shape Our Future — by Kevin Kelly
- The Master Algorithm: How the Quest for the Ultimate Learning Machine Will Remake Our World — by Pedro Domingos
- The Second Machine Age: Work, Progress, and Prosperity in a Time of Brilliant Technologies — by Erik Brynjolfsson and Andrew McAfee
- The Sharing Economy: The End of Employment and the Rise of Crowd-Based Capitalism — by Arun Sundararajan
- What Algorithms Want: Imagination in the Age of Computing — by Ed Finn


Ethics in Data & Machine Learning
- Algorithms of Oppression: How Search Engines Reinforce Racism — by Safiya Umoja Noble
- Automate This: How Algorithms Took Over Our Markets, Our Jobs, and the World — by Chistopher Steiner
- Automating Inequality: How High-Tech Tools Profile, Police, and Punish the Poor — by Virginia Eubanks
- Programmed Inequality: How Britain Discarded Women Technologists and Lost Its Edge in Computing (History of Computing) — by Marie Hicks
- Technically Wrong: Sexist Apps, Biased Algorithms, and Other Threats of Toxic Tech — by Sara Wachter-Boettcher
- The Black Box Society — by Frank Pasquale
- The Rise of Big Data Policing: Surveillance, Race, and the Future of Law Enforcement — by Andrew Guthrie Ferguson
- Weapons of Math Destruction — by Cathy O’Neill

Digital & Data-driven HR
- Calculating Success: How the New Workplace Analytics Will Revitalize Your Organization — by Carl Hoffmann, Eric Lesser, and Tim Ringo
- Data-Driven HR: How to Use Analytics and Metrics to Drive Performance — by Bernard Marr
- Developing Human Capital: Using Analytics to Plan and Optimize Your Learning and Development Investments — by Gene Pease, Barbara Beresford, and Lew Walker
- Digital HR: A Guide to Technology-Enabled Human Resources — by Deborah Waddill
- Employee Surveys That Work: Improving Design, Use, and Organizational Impact — by Alec Levenson
- HR Analytics Handbook — by Laurie Bassi, Rob Carpenter, and Dan McMurrer
- Learning Analytics: Measurement Innovations to Support Employee Development — by John Mattox II, Mark van Buren and Jean Martin
- Making Human Capital Analytics Work: Measuring the ROI of Human Capital Processes and Outcomes — by Jack Phillips and Patricia Pulliam Phillips
- Optimize Your Greatest Asset – Your People: How to Apply Analytics to Big Data to Improve Your Human Capital Investments — by Gene Pease
- People Analytics in the Era of Big Data: Changing the Way You Attract, Acquire, Develop, and Retain Talent — by Jean Paul Isson and Jesse Harriot
- People Analytics: How Social Sensing Technology Will Transform Business and What It Tells Us about the Future of Work — by Ben Waber
- Strategic Analytics: Advancing Strategy Execution and Organizational Effectiveness — by Alec Levenson
- Strategic Workforce Planning: Developing Optimized Talent Strategies for Future Growth — by Ross Sparkman
- The Basics of People Analytics — by Erik van Vulpen
- The Power of People: How Successful Organizations Use Workforce Analytics to Improve Business Performance — by Nigel Guenole, Jonathan Ferrar, and Sheri Feinzig
- Winning on HR Analytics: Leveraging Data for Competitive Advantage — by Ramesh Soundararajan and Kuldeep Singh

Management books
- Adaptive Space: How GM and Other Companies are Positively Disrupting Themselves and Transforming into Agile Organizations — by Michael Arena
- Evidence-Based Management: Making Better Decisions in Organizations — by Eric Barends and Denise Rousseau
- Hard Facts, Dangerous Half-Truths, and Total Nonsense: Profiting from Evidence-Based Management — by Jeffrey Pfeffer and Robert Sutton
- HR from the Outside In: Six Competencies for the Future of Human Resources — by Dave Ulrich
- Human Resource Excellence: An Assessment of Strategies and Trends — by Lawler & Boudreau
- Key Management Ratios — by Ciaran Walsh
- Optimize Human Capital Investments: Make the “Hard” Business Case — by Frank DiBernardino
- Powerful: Building a Culture of Freedom and Responsibility — by Patty McCord
- Predicting Success: Evidence-Based Strategies to Hire the Right People and Build the Best Team — by David Lahey
- Sensemaking: The Power of the Humanities in the Age of the Algorithm — by Christian Madsbjerg
- The Alliance: Manageing Talent in the Networked Age — by Reid Hoffman
- The Data-Driven Leader: A Powerful Approach to Delivering Measurable Business Impact through People Analytics — by Jenny Dearborn and David Swanson
- The Decoded Company: Know Your Talent Better Than You Know Your Customers — by Leerom Segal
- The Employee Experience Advantage: How to Win the War for Talent by Giving Employees the Workspaces they Want, the Tools they Need, and a Culture They Can Celebrat — by Jacob Morgan
- The Future of Work: Attract New Talent, Build Better Leaders, and Create a Competitive Organization — by Jacob Morgan
- The HR Scorecard — by Dave Ulrich, Mark Huselid, and Brian Becker
- The Industries of the Future — by Alec Ross
- The Talent Delusion: Why Data, Not Intuition, Is the Key to Unlocking Human Potential — by Tomas Chamorro-Premuzic
- Time, Talent, Energy: Overcome Organizational Drag and Unleash Your Team’s Productive Power — by Michael Mankins and Eric Garton
- Transformative HR: How Great Companies Use Evidence-Based Change for Sustainable Advantage — by John Boudreau and Ravin Jesuthasan
- Victory Through Organization: Why the War for Talent in Failing Your Company and What You can Do About It — by Dave and Mike Ulrich
- Work Rules!: Insights from Inside Google That Will Transform How You Live and Lead — by Laszlo Bock
- The Best is Yet to Come: Expert Advice on Building the New HR — by Tracey Smith
- Strategic Analytics: Advancing Strategy Execution and Organizational Effectiveness — by Alec Levenson


Statistics books
- A Field Guide to Lies and Statistics: A Neuroscientist on How to Make Sense of A Complex World — by Daniel Levitin
- Applied Multiple Regression/Correlation Analysis for the Behavioral Sciences — by Cohen and Cohen
- Designing Experiments and Analyzing Data: A Model Comparison Perspective — by Maxwell, Delaney, & Kelly
- How to Lie with Statistics — by Darrell Huff
- Naked Statistics: Stripping the Dread from the Data — by Charles Wheelan
- The Signal and the Noise: Why So Many Predictions Fail — But Some Don’t — by Nate Silver
- Weaponized Lies: How to Think Critically in the Post-Truth Era — by Daniel Levitin
- Fooled by Randomness: The Hidden Role of Chance in Life and in the Markets — by Nassim Nicholas Taleb
- The Black Swan: The Impact of the Highly Improbable — by Nassim Nicholas Taleb


Applied People Analytics
- Doing HR Analytics – A Practitioner’s Handbook With R Examples — by Lyndon Sundmark
- Predictive HR Analytics: Mastering the HR Metric — by Martin Edwards and Kirsten Edwards
- People Analytics for Dummies — by Mike West
- Predictive HR Analytics — by Cedric Ng Mong Shen
- People Analytics & Text Mining with R — by Cedric Ng Mong Shen
- Predictive HR Analytics, Text Mining & Organizational Network Analysis: with Excel — by Cedric Ng Mong Shen
- Investing in People: Financial Impact of Human Resource Initiatives — by Wayne Cascio and John Bourdreau

Programming
You can find an overview of 20+ free programming books here.
Data Visualization books
- #MakeoverMonday: Improving How We Visualize and Analyze Data, One Chart at a Time — by Andy Kreibel
- Better Presentations: A Guide for Scholars, Researchers, and Wonks — by Jon Schwabish
- D3.js in Action: Data Visualization with Javascript — by Elijah Meeks
- Data Visualization: A Practical Introduction — by Kieran Healy
- Data Visualization: Charts, Maps, and Interactive Graphics — by Robert Grant
- Fundamentals of Data Visualization — by Claus Wilke
- How to Win Friends and Influence People — by Dale Carnegie
- Information is Beautiful — by David McCandless
- Interactive Data Visualization for the Web: An Introduction to Designing with D3 — by Scott Murray
- Knowledge is Beautiful — by David McCandless
- Storytelling with Data — by Cole Nussbaumer Knaflic
- The Functional Art: An introduction to information graphics and visualization (Voices That Matter) — by Alberto Cairo
- The Truthful Art: Data, Charts, and Maps for Communication — by Alberto Cairo
- Visual Miscellaneum — by David McCandless
- Visualization Analysis and Design — by Tamara Munzner


A note of thanks
I want to thank the active people analytics community, publishing in management journals, but also on social media. I knew Littral Shemer Haim already hosted a people analytics reading list, and so did Analytics in HR (Erik van Vulpen) and Workplaceif (Manoj Kumar). After Jared Valdron called for book recommendation on people analytics on LinkedIn, and nearly 60 people replied, I thought let’s merge these overviews.
Hence, a big thank you and acknowledgement to all those who’ve contributed directly or indirectly. I hope this comprehensive merged overview is helpful.